Buy Now Free
- Level Foundation
- المدة 3 ساعات hours
-
Offered by

عن
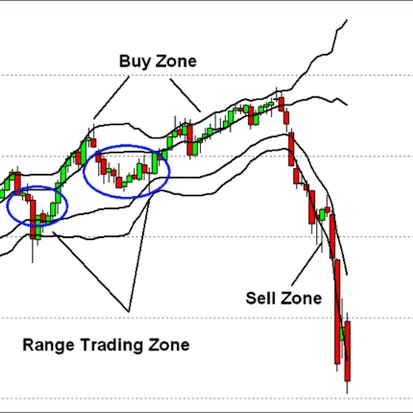
In this 1-hour long project-based course, you will learn how to pull down Stock Data using the R quantmod Package and Yahoo Finance API. You will also learn how to apply Technical Indicators to the data and draw graphs based on those Indicators. Note: This course works best for learners who are based in the North America region. We’re currently working on providing the same experience in other regions.Auto Summary
This beginner-friendly course, "Create Technical Stock Charts Using R and Quantmod," is ideal for those interested in personal development and financial analysis. In just 1 hour, you'll master pulling stock data using the R quantmod Package and Yahoo Finance API. Offered by Coursera, this project-based course is free and perfect for anyone eager to enhance their technical charting skills with R.