Buy Now Free
- Level Professional
- المدة 3 ساعات hours
-
Offered by

عن
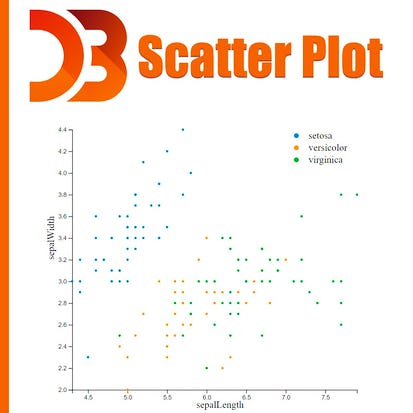
During this guided project, you will create a simple scatter plot using D3 js. Starting from loading our dataset we are going to cover some steps in order to create a fully functional scatter plot. We will also cover some important topics in data visualization such as Linear and Ordinal scaling to best visualize our data. Having the knowledge of javascript programming language and the basics of d3 js are the two most important prerequisites to get the most out of this guided project.Auto Summary
Learn to create a simple scatter plot using D3.js in this intermediate-level guided project. Offered by Coursera in the Personal Development domain, this 180-minute course is perfect for those looking to enhance their data visualization skills. Enroll for free and master D3.js with expert guidance.