- Level Foundation
- المدة 9 ساعات hours
- الطبع بواسطة Coursera Instructor Network
-
Offered by

عن
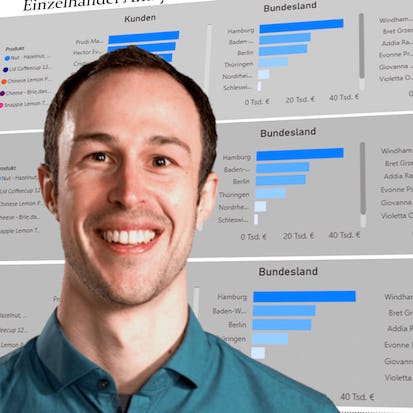
✓ Master Power BI Desktop from end-to-end ✓ Create impressive reports with Power BI ✓ Work professionally with Power BI Microsoft Power BI Desktop is the perfect tool for creating impressive reports, and this course will teach you everything you need to know to become an advanced report creator. Whether you're new to Power BI or already have some basic knowledge, this course will help you dive deeper into the universe of Power BI and gain a thorough understanding of the software. Throughout the course, you will learn how to connect different data sources, create your data model, and use all the important tools properly. You'll also learn how to effectively visualize your data through storytelling with data and create interactive visualizations with drill throughs and drill downs. In addition, this course covers advanced analytics such as forecasting, which can be helpful in data science. If you're struggling to get on track with Power BI, this course offers practical techniques to help you master tough subjects. If you're already an expert, you'll find ideas for turbocharging successful learning. Enroll now to gain lifelong access to this course and become an advanced report developer in Power BI.الوحدات
Introduction to Power BI Desktop
4
Videos
- Welcome to Power BI!
- What is Power BI?
- Download & Install Power BI Desktop
- Quick Interface Tour
Mini Project in Power BI
4
Videos
- Transform Data
- Visualize Data
- Data Modeling
- Roadmap of this course
Preparing our Project
1
Assignment
- Working with the attached .pbix files
2
Videos
- Create initial project file
- Working with attached project files
First steps in the Power Query Editor
1
Assignment
- Query Editor
6
Videos
- Exploring the Query Editor
- Connecting to data source
- Editing rows
- Changing data types
- Replacing values
- Close & Apply
Connecting to csv & web page
3
Videos
- Connect to a csv file
- Connect to web page
- Extracting characters
Create additional columns
3
Videos
- Splitting & merging columns
- Creating conditional columns
- Creating columns from examples
1
Readings
- Note regarding next lecture
Merging & Appending Queries + Pivoting & Unpivoting
1
Assignment
- Data Transformation
3
Videos
- Merging Queries
- Pivoting & Unpivoting
- Appending Queries
Practice & Fact-Dimension-Model
3
Videos
- Practice: Data Transformation
- Fact-Dimension-Model
- Practice: Dimension table
Additional Data Transformation Tools
4
Videos
- Organizing queries in groups
- Enter data manually
- Create index column
- More transformations
1
Readings
- Text to be used in next video
Summary and practice
3
Videos
- Module Summary
- Data Transformation Practice
- Data Transformation Solution
Advanced Editor
1
Videos
- Advanced Editor
Performance
2
Videos
- Referencing vs. Duplicating
- Enable & Disable Load
Group By, Mathematical Operations & Parameters
5
Videos
- Group By
- Mathematical Operations
- Dynamically transform data with parameters
- Practice: Advanced Data Transformations
- Solution: Advanced Data Transformations
Data Model Basics
3
Videos
- Why do we need a data model?
- Create and edit relationships
- One-to-many & one-to-one relationships
Many-to-Many, Cross filter direction and inactive relationships
3
Videos
- Many-to-Many relationship
- Cross filter direction
- Activate & deactivate relationships
Summary and Practice
1
Assignment
- Data Model
3
Videos
- Module summary
- Practice: Data Modeling
- Solution: Data Modeling
Data Visualization Basics
2
Videos
- First visual
- Formatting a visual
Table Visual
2
Videos
- Understanding Tables
- Conditional formatting
Pie Chart
1
Videos
- Pie Chart
Filtering
6
Videos
- Slicer visual
- Filter pane
- Cross filtering & edit interactions
- Practice Data Visualization
- Solution Data Visualization
- Sync slicers
Drill down and drill through
2
Videos
- Creating drill downs
- Creating drill throughs
More visuals
3
Videos
- Tree map visual
- Decomposition tree
- Matrix visual
Edit pages, buttons & bookmarks
3
Videos
- Editing pages
- Buttons & actions
- Bookmarks to customize report
Forecasting in Power BI
1
Videos
- Analytics with line charts
Design principles & best practices
8
Videos
- Visualization best practices
- Empathy
- Most suitable KPI
- Most effective visual
- Natural reading patterns
- Visual cues and storytelling
- Avoid chaos & group information
- Summary
Auto Summary
Master Power BI Desktop in this comprehensive bootcamp designed for both beginners and advanced users in Big Data and Analytics. Led by Coursera, this course covers everything from connecting data sources to creating interactive visualizations and advanced analytics like forecasting. With practical techniques and lifelong access, you'll become an expert report developer in just 540 minutes. Available with Starter and Professional subscription options, this foundational course is perfect for anyone looking to enhance their data storytelling skills. Enroll now!

Nikolai Schuler


