


Generative AI for Business Leaders
Advertising with Meta
How Google does Machine Learning


دوراتنا

Text Mining for Marketing
Welcome to the Text Mining for Marketing course! This course will introduce you to the principles and methods of text mining as they apply to the field of marketing. You will learn how and why to use text mining to inform marketing decisions and strategies. This course is for everyone interested in practical applications of text mining in the marketing discipline and who wants to understand it and apply it. This course is not for those who are looking for programming instructions and mathematical routines.
-
Course by

-
 Self Paced
-
 21 ساعات
-
 الإنجليزية

Assisting Public Sector Decision Makers With Policy Analysis
Develop data analysis skills that support public sector decision-makers by performing policy analysis through all phases of the policymaking process. You will learn how to apply data analysis techniques to the core public sector principles of efficiency, effectiveness, and equity. Through authentic case studies and data sets, you will develop analytical skills commonly used to analyze and assess policies and programs, including policy options analysis, microsimulation modeling, and research designs for program and policy evaluation.
-
Course by
-
Self Paced
-
16 ساعات
-
الإنجليزية
Intro to Improving the Patient Experience Through Analytics
This course is best suited for individuals currently in the healthcare sector, as a provider, payer, or administrator. Individuals pursuing a career change to the healthcare sector may also be interested in this course. In this course, you will have an opportunity to explore concepts and topics related to improving the patient experience and reducing pain points in healthcare processes through analytic and decision support frameworks.
-
Course by
-
Self Paced
-
20 ساعات
-
الإنجليزية

Using clinical health data for better healthcare
Digital health is rapidly being realised as the future of healthcare.
-
Course by
-
Self Paced
-
16 ساعات
-
الإنجليزية

Designing Engaging Dashboards for Healthcare Analytics
Introduces processes and design principles for creating meaningful displays of information that support effective business decision-making. Studies how to collect and process data; create visualizations (both static and interactive); and use them to provide insight into a problem, situation, or opportunity. Introduces methods to critique visualizations along with ways to answer the elusive question: “What makes a visualization effective?” Discusses the challenges of making data understandable across a wide range of audiences.
-
Course by
-
Self Paced
-
16 ساعات
-
الإنجليزية
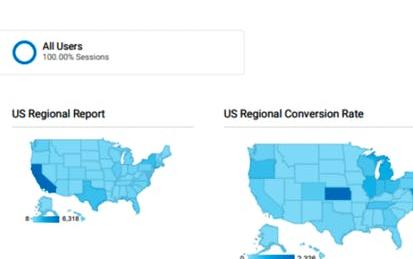
Building Custom Regional Reports with Google Analytics
In this 2 hours project you will learn how to build custom regional reports with Google Analytics. You will familiarize with Google Analytics and its usage, create a marketing custom regional dashboard with table and graph widgets, customize a standard geo report and scheduled the report you have designed to be sent monthly via email to a distributed regional marketing team.
-
Course by
-
Self Paced
-
3 ساعات
-
الإنجليزية

Database Engineer Capstone
In this course you’ll complete a capstone project in which you’ll create a database and client for Little Lemon restaurant. To complete this course, you will need database engineering experience. The Capstone project enables you to demonstrate multiple skills from the Certificate by solving an authentic real-world problem. Each module includes a brief recap of, and links to, content that you have covered in previous courses in this program.
-
Course by
-
Self Paced
-
18 ساعات
-
الإنجليزية
AWS: Security in Data Analytics
AWS: Security in Data Analytics Course is the fourth course of AWS Certified Data Analytics Speciality Specialization. This course teaches learners the concepts of Security in Data Analytics with reference to AWS. Learners will be able to analyze appropriate authentication and authorization mechanisms, apply data protection and encryption techniques and data governance and compliance controls in this course. The course is divided into three modules and each module is further segmented by Lessons and Video Lectures.
-
Course by
-
Self Paced
-
6 ساعات
-
الإنجليزية

Tools for Exploratory Data Analysis in Business
This course introduces several tools for processing business data to obtain actionable insight. The most important tool is the mind of the data analyst. Accordingly, in this course, you will explore what it means to have an analytic mindset. You will also practice identifying business problems that can be answered using data analytics. You will then be introduced to various software platforms to extract, transform, and load (ETL) data into tools for conducting exploratory data analytics (EDA).
-
Course by
-
Self Paced
-
19 ساعات
-
الإنجليزية
Gender Analytics Capstone Project
It’s time to use your Gender Analytics skills to tackle a real-world challenge in your capstone project. In the final course in the Gender Analytics Specialization offered by the Institute for Gender and the Economy (GATE) at the University of Toronto's Rotman School of Management, you will practice your Gender Analytics skills in an applied learning project that will take you through the entire process for using gender-based insights to generate innovative solutions.
-
Course by
-
Self Paced
-
9 ساعات
-
الإنجليزية

Machine Learning Modeling Pipelines in Production
**Starting May 8, enrollment for the Machine Learning Engineering for Production Specialization will be closed.
-
Course by
-
Self Paced
-
48 ساعات
-
الإنجليزية
Data Analytics Foundations for Accountancy I
Welcome to Data Analytics Foundations for Accountancy I! You’re joining thousands of learners currently enrolled in the course. I'm excited to have you in the class and look forward to your contributions to the learning community.
To begin, I recommend taking a few minutes to explore the course site. Review the material we’ll cover each week, and preview the assignments you’ll need to complete to pass the course. Click Discussions to see forums where you can discuss the course material with fellow students taking the class.
-
Course by
-
Self Paced
-
67 ساعات
-
الإنجليزية
Business Intelligence and Visual Analytics
Building on “Data Warehousing and Business Intelligence,” this course focuses on data visualization and visual analytics. Starting with a thorough coverage of what data visualization is and what type of visualization is good for a given purpose, the course quickly dives into development of practical skills and knowledge about visual analytics by way of using one of the most popular visual analytics tools: SAS Viya, a cloud-based analytics platform. An overview of cloud architecture, automation, and machine learning is also provided.
-
Course by
-
Self Paced
-
12 ساعات
-
الإنجليزية

How to Analyze Tweet Engagement with Twitter Analytics
Twitter is a dynamic social media platform that prides itself on furthering conversations in real-time. Known as a platform that features short-form text it is intended to be brief, direct, impactful, and a living source of information. Businesses are increasingly taking part in this conversation and are finding new and different ways to further their brand experience on this increasingly popular platform. In this project, learners will learn how to use Twitter Analytics to analyze tweet engagement using Twitter Analytics.
-
Course by
-
Self Paced
-
1 ساعات
-
الإنجليزية
Infonomics I: Business Information Economics and Data Monetization
Thriving in the Information Age compels organizations to deploy information as an actual business asset, not as an IT asset or merely as a business byproduct. This demands creativity in conceiving and implementing new ways to generate economic benefits from the wide array of information assets available to an organization. Unfortunately, information too frequently is underappreciated and therefore underutilized.
-
Course by
-
Self Paced
-
14 ساعات
-
الإنجليزية
Big Data, Genes, and Medicine
This course distills for you expert knowledge and skills mastered by professionals in Health Big Data Science and Bioinformatics. You will learn exciting facts about the human body biology and chemistry, genetics, and medicine that will be intertwined with the science of Big Data and skills to harness the avalanche of data openly available at your fingertips and which we are just starting to make sense of.
-
Course by
-
Self Paced
-
40 ساعات
-
الإنجليزية

Statistics for Marketing
This course takes a deep dive into the statistical foundation upon which marketing analytics is built. The first part of this course will help you to thoroughly understand your dataset and what the data actually means. Then, it will go into sampling including how to ask specific questions about your data and how to conduct analysis to answer those questions.
-
Course by
-
Self Paced
-
17 ساعات
-
الإنجليزية
Sneak Peek: Dartmouth's Digital Transformation Certificate
This course introduces you to Dartmouth’s Digital Transformation Certificate Program.
-
Course by
-
Self Paced
-
10 ساعات
-
الإنجليزية
Using SAS Viya REST APIs with Python and R
SAS Viya is an in-memory distributed environment used to analyze big data quickly and efficiently. In this course, you’ll learn how to use the SAS Viya APIs to take control of SAS Cloud Analytic Services from a Jupyter Notebook using R or Python. You’ll learn to upload data into the cloud, analyze data, and create predictive models with SAS Viya using familiar open source functionality via the SWAT package -- the SAS Scripting Wrapper for Analytics Transfer. You’ll learn how to create both machine learning and deep learning models to tackle a variety of data sets and complex problems.
-
Course by
-
Self Paced
-
18 ساعات
-
الإنجليزية
Applying Data Analytics in Accounting
This course explores business analytic applications in accounting. First, it presents a survey of technology topics in accounting, including process mining, blockchain and applications in audit, tax, and assurance. Next, the course explores visualization and basic analytics in audit and control testing using R and Alteryx. Next, the course examines the uses of text analysis in accounting and conducts text analysis using R and RStudio. Finally, the course examines robot process automation in general using UiPath and its applications in accounting.
-
Course by
-
Self Paced
-
14 ساعات
-
الإنجليزية

Create IoT Solutions in Microsoft Azure
In this 1-hour long project-based course, you will learn to create an IoT hub in the Azure cloud, and learn to use the Azure IoT Hub extension for Visual Studio Code to monitor and send device-to-cloud messages and cloud-to-device messages. Then you will learn to create an Azure storage account and create a stream analytics job with an IoT hub as input and a storage account as output so that the messages can be stored on the Azure storage.
-
Course by
-
Self Paced
-
3 ساعات
-
الإنجليزية
Google Data Analytics Capstone: Complete a Case Study
This course is the eighth and final course in the Google Data Analytics Certificate. You’ll have the opportunity to complete a case study, which will help prepare you for your data analytics job hunt. Case studies are commonly used by employers to assess analytical skills. For your case study, you’ll choose an analytics-based scenario. You’ll then ask questions, prepare, process, analyze, visualize and act on the data from the scenario. You’ll also learn about useful job hunting skills, common interview questions and responses, and materials to build a portfolio online.
-
Course by
-
Self Paced
-
9 ساعات
-
الإنجليزية
Applied Analytics and Data for Decision Making
By the end of this course, learners are prepared to identify and test the best solutions for improving performance and integrating concepts from operational excellence methodologies for optimum data-driven decision making. The course begins with a focus on deciphering the root cause of problems through a variety of tools before determining and assessing best-fit solutions. Learners discover how to apply ISO, Lean and Six Sigma in the pursuit of aligning organizational operations data with performance standards.
-
Course by
-
Self Paced
-
11 ساعات
-
الإنجليزية
Google Advanced Data Analytics Capstone
You’re almost there! This is the seventh and final course of the Google Advanced Data Analytics Certificate. In this course, you have the opportunity to complete an optional capstone project that includes key concepts from each of the six preceding courses.
-
Course by
-
Self Paced
-
10 ساعات
-
الإنجليزية
Politics and Ethics of Data Analytics in the Public Sector
Deepen your understanding of the power and politics of data in the public sector, including how values — in addition to data and evidence — are always part of public sector decision-making. In this course, you will explore common ethical challenges associated with data, data analytics, and randomized controlled trials in the public sector. You will also navigate and understand the ethical issues related to data systems and data analysis by understanding frameworks, codes of ethics, and professional guidelines.
-
Course by
-
Self Paced
-
14 ساعات
-
الإنجليزية