


Generative AI for Business Leaders
Advertising with Meta
How Google does Machine Learning


دوراتنا

Salesforce Reporting
Salesforce Reporting focuses on how the micro-level changes in Salesforce affect the macro level of the user experience. In this course, you will focus on creating custom objects, field dependencies, and work flows to track accounts or services. It is also important that you maintain data clean for your organization and you will work with creating reports, managing data, and creating full reports and dashboards. Lastly, you will focus on your customer base with Salesforce Service Cloud to maintain engagement through your services.
-
Course by

-
 Self Paced
-
 24 ساعات
-
 الإنجليزية

BI Foundations with SQL, ETL and Data Warehousing
The job market for business intelligence (BI) analysts is expected to grow by23 percent from 2021 to 2031 (US Bureau of Labor Statistics). This IBM specialization gives you sought-after skills employers look for when recruiting for a BI analyst. BI analysts gather, clean, and analyze key business data to find patterns and insights that aid business decision-making. During this specialization, you’ll learn the basics of SQL, focusing on how to query relational databases using this popular and powerful language. You’ll use essential Linux commands to create basic shell scripts.
-
Course by
-
Self Paced
-
الإنجليزية

Data Visualization and Building Dashboards with Excel and Cognos
Build the fundamental knowledge necessary to use Excel and IBM Cognos Analytics to create data visualizations and to create dashboards containing those visualizations to help tell a lucid story about data.
-
Course by

-
Self Paced
-
28
-
الإنجليزية

Try It: Explore Google Looker Studio
Google Looker - formerly Google Data Studio - gives you a shortcut to compelling and actionable dashboards that makes your data sing.
-
Course by
-
1
-
الإنجليزية
Build a Data Science Web App with Streamlit and Python
Welcome to this hands-on project on building your first data science web app with the Streamlit library in Python. By the end of this project, you are going to be comfortable with using Python and Streamlit to build beautiful and interactive web apps with zero web development experience! We are going to load, explore, visualize and interact with data, and generate dashboards in less than 100 lines of Python code!
Prior experience with writing simple Python scripts and using pandas for data manipulation is recommended.
-
Course by
-
Self Paced
-
2 ساعات
-
الإنجليزية

Cognitive Solutions and RPA Analytics
Millions of companies in the world today are processing endless documents in various formats. Although Robotic Process Automation (RPA) thrives in almost every industry and is growing fast, it works well only with structured data sources.
What about the data that’s not fully structured and comes in varying layouts? To address this problem, there is another aspect of RPA that is taking the industry by storm: cognitive automation.
-
Course by
-
Self Paced
-
5 ساعات
-
الإنجليزية

Analizando Redes Sociales en Power BI: Campañas de Instagram
El Proyecto Guiado "Analizando Redes Sociales en Power BI: Campañas de Instagram" es para Construir un dashboard de datos que nos permita analizar de forma efectiva la data obtenida y obtener indicadores relevantes de marketing de Instagram que impacten en el negocio.
-
Course by
-
Self Paced
-
2 ساعات
-
الإسبانية

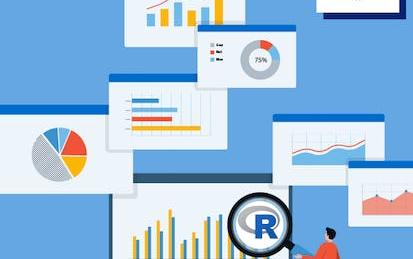
Advanced Data Visualization with R
Data visualization is a critical skill for anyone that routinely using quantitative data in his or her work - which is to say that data visualization is a tool that almost every worker needs today. One of the critical tools for data visualization today is the R statistical programming language. Especially in conjunction with the tidyverse software packages, R has become an extremely powerful and flexible platform for making figures, tables, and reproducible reports.
-
Course by
-
Self Paced
-
11 ساعات
-
الإنجليزية
Data Cleaning in Snowflake: Techniques to Clean Messy Data
in 2006, the British mathematician Clive Humby coined the phrase "Data is the new Oil". This analogy has been proven correct as data powers entire industries nowadays but if left unrefined, is effectively worthless. This 2.5 hours-long guided project is designed for business analysts & data engineers eager to learn how to Clean Messy Data in Snowflake Data Platform. By the end of the project, you will -Be able to identify common data quality issues then use SQL String functions to remove unwanted characters and split rows into multiple columns.
-
Course by
-
Self Paced
-
3 ساعات
-
الإنجليزية

Create Charts and Dashboards Using Microsoft Excel
In this project, you will learn how to create charts in Microsoft Excel to analyze sales data of a sample company. You will learn how to create PivotTables to assess different aspects of the sales information, and represent the information from the tables as line, bar, and pie charts. When creating the charts, you will learn how to format them so they are easily interpreted and you will then assemble the charts in a dashboard to provide a global picture of the sales data.
-
Course by
-
Self Paced
-
3 ساعات
-
الإنجليزية

Data Visualization with R
In this course, you will learn the Grammar of Graphics, a system for describing and building graphs, and how the ggplot2 data visualization package for R applies this concept to basic bar charts, histograms, pie charts, scatter plots, line plots, and box plots. You will also learn how to further customize your charts and plots using themes and other techniques. You will then learn how to use another data visualization package for R called Leaflet to create map plots, a unique way to plot data based on geolocation data.
-
Course by
-
Self Paced
-
12 ساعات
-
الإنجليزية
Create a Marketing Analysis dashboard using G-Spreadsheets
In this 1-hour long project-based course, you will learn how to enter any data set on google sheets, organize and format your rows and columns, create drop down lists, create basic query formulas related to the data set and finally translate those formulas into dashboard and charts to help you better visualize your analysis. This will help beginner market analysts to prepare reports and dashboards to present it to their managers. Note: This course works best for learners who are based in the North America region. We’re currently working on providing the same experience in other regions.
-
Course by
-
Self Paced
-
2 ساعات
-
الإنجليزية
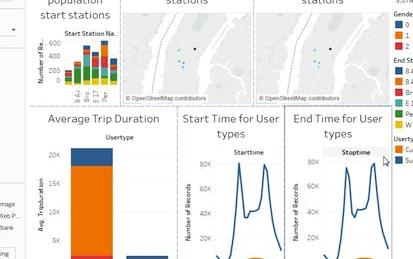
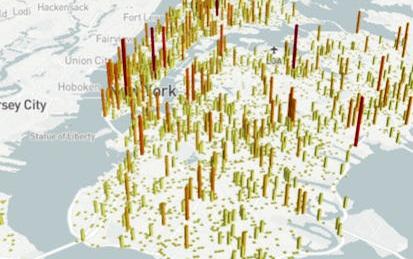
Visualizing Citibike Trips with Tableau
In this 1-hour long project-based course, you will learn the basics of using Tableau Public software to visualize Citibike Trips Dataset. By the end of this project, you will have created a few visualizations and a collection of visualizations called a dashboard.
Note: This course works best for learners who are based in the North America region. We’re currently working on providing the same experience in other regions.
-
Course by
-
Self Paced
-
3 ساعات
-
الإنجليزية

Getting Started with Data Analytics on AWS
Learn how to go from raw data to meaningful insights using AWS with this one-week course. Throughout the course, you’ll learn about the fundamentals of Data Analytics from AWS experts. Start off with an overview of different types of data analytics techniques - descriptive, diagnostic, predictive, and prescriptive before diving deeper into the descriptive data analytics. Then, apply your knowledge with a guided project that makes use of a simple, but powerful dataset available by default in every AWS account: the logs from AWS CloudTrail.
-
Course by
-
Self Paced
-
4 ساعات
-
الإنجليزية

Excel for Everyone: Data Analysis Fundamentals
Perform advanced data wrangling, analysis and dashboard visualization to help drive strategic decision-making.
-
Course by
-
Self Paced
-
الإنجليزية
Data-Driven Decision Making (DDDM)
This specialization explains why it is important to leverage data when contemplating organizational choices, and supplies the tools at the heart of data-driven decision making (DDDM). The three-course series explores how technology enables the collection and organization of unprecedented amounts of data, and how to dissect that data to gain powerful insights.
-
Course by
-
Self Paced
-
الإنجليزية

Big Data Analysis Deep Dive
The job market for architects, engineers, and analytics professionals with Big Data expertise continues to increase. The Academy’s Big Data Career path focuses on the fundamental tools and techniques needed to pursue a career in Big Data. This course includes: data processing with python, writing and reading SQL queries, transmitting data with MaxCompute, analyzing data with Quick BI, using Hive, Hadoop, and spark on E-MapReduce, and how to visualize data with data dashboards.
-
Course by
-
Self Paced
-
14 ساعات
-
الإنجليزية

Data Visualization with Tableau
In 2020 the world will generate 50 times the amount of data as in 2011. And 75 times the number of information sources (IDC, 2011). Being able to use this data provides huge opportunities and to turn these opportunities into reality, people need to use data to solve problems. This Specialization, in collaboration with Tableau, is intended for newcomers to data visualization with no prior experience using Tableau. We leverage Tableau's library of resources to demonstrate best practices for data visualization and data storytelling.
-
Course by
-
Self Paced
-
الإنجليزية
Data Visualization & Dashboarding with R
This Specialization is intended for learners seeking to develop the ability to visualize data using R. Through five courses, you will use R to create static and interactive data visualizations and publish them on the web, which will you prepare you to provide insight to many types of audiences.
-
Course by
-
Self Paced
-
الإنجليزية
Snowflake for Beginners: Make your First Snowsight Dashboard
According to a recent Coursera study(*), there are 7 most in-demand skills in the data world. Among these skills is data management, which refers to the practice of effectively collecting, organizing, storing, and analyzing data. While some organizations will have dedicated data management roles, data analysts often manage data to some degree.
-
Course by
-
Self Paced
-
3 ساعات
-
الإنجليزية

Use Power Bi for Financial Data Analysis
In this project, learners will have a guided look through Power Bi dynamic reports and visualizations for financial data analysis. As you view, load, and transform your data in Power Bi, you will learn which steps are key to making an effective financial report dashboard and how to connect your report for dynamic visualizations. Data reporting and visualization is the most critical step in a financial, business, or data analyst’s functions. The data is only as effective if it can be communicated effectively to key stakeholders in the organization. Effective communication of data starts here.
-
Course by
-
Self Paced
-
3 ساعات
-
الإنجليزية

IBM Data Analytics with Excel and R
Prepare for the in-demand field of data analytics. In this program, you’ll learn high valued skills like Excel, Cognos Analytics, and R programming language to get job-ready in less than 3 months. Data analytics is a strategy-based science where data is analyzed to find trends, answer questions, shape business processes, and aid decision-making. This Professional Certificate focuses on data analysis using Microsoft Excel and R programming language.
-
Course by
-
Self Paced
-
الإنجليزية

Excel Skills for Business
This specialization is intended for anyone who seeks to develop one of the most critical and fundamental digital skills today. Spreadsheet software remains one of the most ubiquitous pieces of software used in workplaces across the world. Learning to confidently operate this software means adding a highly valuable asset to your employability portfolio. In the United States alone, millions of job advertisements requiring Excel skills are posted every day. Research by Burning Glass Technologies and Capital One shows that digital skills lead to higher income and better employment opportunities.
-
Course by
-
Self Paced
-
الإنجليزية
Splunk Search Expert
By completing Search Expert 101, 102 & 103, you will be able to write efficient searches, perform correlations, create visualizations, and leverage subsearches and lookups. This course will also show you how to get started using your machine data to provide actionable reports and dashboards for your organization.
-
Course by
-
Self Paced
-
الإنجليزية

Microsoft Power BI Data Analyst
Learners who complete this program will receive a 50% discount voucher to take the PL-300 Certification Exam. Business Intelligence analysts are highly sought after as more organizations rely on data-driven decision-making.
-
Course by
-
Self Paced
-
الإنجليزية