


Generative AI for Business Leaders
Advertising with Meta
How Google does Machine Learning


دوراتنا
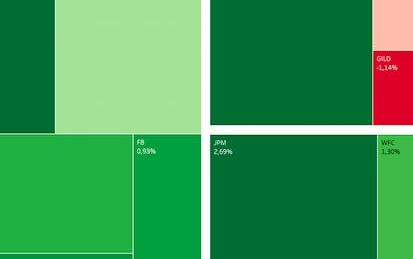
Building Stock Returns Heatmap with Tableau
In this 1-hour long project-based course, you will learn how to extract stock data using Google Finance, build a Heat and Treemap in Tableau, build a stock returns dashboard in Tableau.
Note: This course works best for learners who are based in the North America region. We're currently working on providing the same experience in other regions.
This course's content is not intended to be investment advice and does not constitute an offer to perform any operations in the regulated or unregulated financial market.
-
Course by

-
 Self Paced
-
 2 ساعات
-
 الإنجليزية
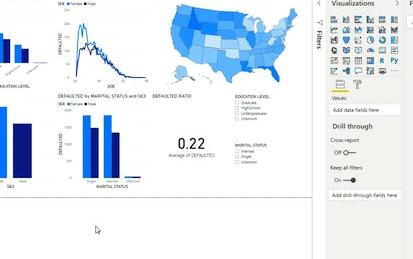
Getting Started with Power BI Desktop
In this 2-hour long project-based course, you will learn the basics of using Power BI Desktop software. We will do this by analyzing data on credit card defaults with Power BI Desktop. Power BI Desktop is a free Business Intelligence application from Microsoft that lets you load, transform, and visualize data. You can create interactive reports and dashboards quite easily, and quickly. We will learn some of the basics of Power BI by importing, transforming, and visualizing the data.
-
Course by
-
Self Paced
-
2 ساعات
-
الإنجليزية

Create Digital Marketing Campaign Dashboards in Tableau
How we consume data is often just as important as the data itself. If data remains in columns and rows and is a matrix of numbers, it will continue to be mysterious, confusing, and misunderstood. One of the most powerful ways that data can be easily understood is by making a dashboard. Tableau dashboards are easy to create, interactive, and highly customizable. In this video, learners will learn how to create a digital marketing dashboard. Along the way, they will learn the Tableau techniques that are easily applicable to business spaces outside of digital marketing.
-
Course by
-
Self Paced
-
3 ساعات
-
الإنجليزية

How to Get Skilled: Introduction to Individual Skills Management (Project-Centered Course)
Do you want to gain a competitive edge on the job market? Would you like to improve the way that you organize, manage, and present your skills to succeed in a competency-based, competitive job selection? Have you prepared to compete for jobs in the age of AI-powered recruiting? This advanced, project-centered course* is designed for working professionals who want to direct their skill-building activities towards creating powerful, evidence-based, data-driven, and externally verified job applications.
-
Course by
-
Self Paced
-
9 ساعات
-
الإنجليزية
Data Visualization in Tableau: Create Dashboards and Stories
Use Tableau Web Authoring to create best practice dashboards and stories from data
-
Course by
-
Self Paced
-
2 ساعات
-
الإنجليزية

AWS: Security and Cost Optimization strategies
AWS: Security and Cost Optimization Strategies Course is the third course of Exam Prep: AWS Certified SysOps Administrator - Associate Specialization. This course focuses on cost optimization and the efficient use of various AWS services. By the end of this course, you will be able to: - Understand pay-as-you-go model. - Identify cost optimization strategies in AWS. - Identify AWS and customer responsibilities respectively. To succeed in this course, you should have basic knowledge of AWS Budgets and Billing Dashboard.
-
Course by
-
Self Paced
-
5 ساعات
-
الإنجليزية
Monitoring Kubernetes Cluster using Prometheus and Grafana
In this 2-hour long project-based course on monitoring Kubernetes cluster using Prometheus and Grafana, you will learn to create a Kubernetes cluster using kind. You will also learn to create create deployment and service in our Kubernetes cluster. At the end of the course you will to deploy and explore Kubernetes Dashboard (Web-UI), scrape key metrics using Prometheus, and finally, visualize the scraped metrics on Grafana dashboards.
-
Course by
-
Self Paced
-
4 ساعات
-
الإنجليزية
Introduction to Widgets for Data Science
In this 2-hour long project-based course, you will learn what are widgets, how they can used for data science work, types of widgets, linking multiple widgets, basic dashboards of widgets and creating child widgets.
-
Course by
-
Self Paced
-
3 ساعات
-
الإنجليزية

Splunk Knowledge Manager 103
In this course, you will go beyond dashboard basics and learn about Dashboard Studio's underlying framework, the dashboard development process from prototyping and wireframing to troubleshooting as well as adding visualizations, dynamic coloring and drilldowns. Then you will go further by making your dashboards interactive with user inputs. You will learn how to use mock data, add annotation searches to a visualization, and improve dashboard performance.
-
Course by
-
Self Paced
-
5 ساعات
-
الإنجليزية
Create a Big Number KPI Dashboard in Tableau Public
Tableau is widely recognized as one of the premier data visualization software programs. For many years access to the program was limited to those who purchased licenses. Recently, Tableau launched a public version that grants the ability to create amazing data visualizations for free. Account members can also share and join projects to collaborate on projects that can change the world.
By the end of this project, you will learn how to create an easy-to-understand communication that will focus attention on specific metrics that guide decisions.
-
Course by
-
Self Paced
-
2 ساعات
-
الإنجليزية
Sales Reporting with HubSpot
In this course, you will use your business data and identify key metrics in order to report on sales with HubSpot’s dashboards. First, you will learn how to operate a data-driven business and how to audit, clean, and organize your data within HubSpot’s CRM. You will then learn to identify the key metrics used to analyze your data on sales and customer service success, within the stages of the Inbound Methodology. This will cover types of testing, using the Sales Hub tools, and reporting in each stage of the methodology.
-
Course by
-
Self Paced
-
الإنجليزية

How to design Facebook/IG Stories using Canva
In this 1-hour long project-based course, you will learn how to create designs for Instagram/Facebook stories using Canva. We will use the Canva platform to create social media(Instagram and Facebook) stories using built-in templates as well as from the scratch. This course includes Canva introduction, exploration of Canva dashboard, you will learn to use different elements from Canva, creation of social media stories using built-in templates, and from the scratch.
-
Course by
-
Self Paced
-
2 ساعات
-
الإنجليزية
Understanding Your Google Cloud Costs
Understanding Your Google Cloud Costs is most suitable for those working in a technology or finance role who are responsible for managing Google Cloud costs. You’ll learn how to set up a billing account, organize resources, and manage billing access permissions. In the hands-on labs, you'll learn how to view your invoice, track your Google Cloud costs with Billing reports, analyze your billing data with BigQuery or Google Sheets, and create custom billing dashboards with Looker Studio. Students enrolling in this course do not need any prior Google Cloud technical experience.
-
Course by
-
Self Paced
-
5 ساعات
-
الإنجليزية

From Excel to Power BI
Are you using Excel to manage, analyze, and visualize your data? Would you like to do more? Perhaps you've considered Power BI as an alternative, but have been intimidated by the idea of working in an advanced environment. The fact is, many of the same tools and mechanisms exist across both these Microsoft products. This means Excel users are actually uniquely positioned to transition to data modeling and visualization in Power BI! Using methods that will feel familiar, you can learn to use Power BI to make data-driven business decisions using large volumes of data.
-
Course by
-
Self Paced
-
3 ساعات
-
الإنجليزية

Getting Started with Data Warehousing and BI Analytics
Kickstart your Data Warehousing and Business Intelligence (BI) Analytics journey with this self-paced course. You will learn how to design, deploy, load, manage, and query data warehouses and data marts. You will also work with BI tools to analyze data in these repositories.
-
Course by
-
Self Paced
-
17 ساعات
-
الإنجليزية

HR Analytics- Build an HR dashboard using Power BI
In this 1 hour long project, you will build an attractive and eye-catching HR dashboard using Power BI. We will begin this guided project by importing data & creating an employee demographics page that gives us the overall demographic outlook of the organization. We will then create pie charts and doughnut charts to visualize gender & racial diversity. In the final tasks, we will create an employee detail page that will provide you with all the important information about any employee with just a click.
-
Course by
-
Self Paced
-
2 ساعات
-
الإنجليزية
Interactive Machine Learning Dashboards using Plotly Dash
In this 2 hour long project-based course, you will learn how to create an HTML outline of a Plotly Dash dashboard. You will design interactive dropdown lists, radio buttons, and most importantly, scatter plots and bar charts that respond to your mouse's hover. You will learn how to visualize dimensionality reduction results intuitively and interactively, and see how these models can be used in Customer Segmentation. Furthermore, we will discuss how to critically evaluate these models, and what to look out for in a well-performing model.
-
Course by
-
Self Paced
-
3 ساعات
-
الإنجليزية
Design and Build a Data Warehouse for Business Intelligence Implementation
The capstone course, Design and Build a Data Warehouse for Business Intelligence Implementation, features a real-world case study that integrates your learning across all courses in the specialization.
-
Course by
-
Self Paced
-
45 ساعات
-
الإنجليزية

Create an E-book Cover Using Canva
In this 1-hour long project-based course, you will learn to create an E-book cover using Canva. We will use Canva platform to create ebook covers using different built-in templates from Canva and also from the scratch.
-
Course by
-
Self Paced
-
2 ساعات
-
الإنجليزية
Get, Shape, Combine and Merge the datasets using Power BI
By the end of this project, you will be able to professionally format and manipulate different datasets using Power Bi. you will be able to identify the basics of power BI, use it to create a model, and import data from different types of data sources. Moreover, you will be able to manipulate your data, reduce the number of data, merge columns, replace values, change data types and apply statistical and standard functions. You will also be able to insert a new index column, append two or more queries with each other, and sort and clean your dataset.
-
Course by
-
Self Paced
-
3 ساعات
-
الإنجليزية
Threat Investigation
If you are an associate-level cybersecurity analyst who is working in security operation centers, this course will help you understand how threat-centric SOC must prepare for analyzing new and emerging threats by implementing robust security investigation procedures • By the end of the course, you will be able to: • Understand cyber-threat hunting concepts • Describe the five hunting maturity levels (HM0–HM4) • Describe the hunting cycle four-stage loop• Describe the use of the Common Vulnerability Scoring System (CVSS) and list the CVSS v3.0 base metrics• Describe the CVSS v3.0 scoring compon
-
Course by
-
Self Paced
-
9 ساعات
-
الإنجليزية

Decisions, Decisions: Dashboards and Reports
You’re almost there! This is the third and final course in the Google Business Intelligence Certificate. In this course, you’ll apply your understanding of stakeholder needs, plan and create BI visuals, and design reporting tools, including dashboards.
-
Course by
-
Self Paced
-
27 ساعات
-
الإنجليزية
Data Studio: Qwik Start
This is a self-paced lab that takes place in the Google Cloud console. Data Studio lets you create dynamic, visually compelling reports and dashboards. Watch the short video Data Studio: Qwik Start - Qwiklabs Preview.
-
Course by
-
Self Paced
-
1 ساعات
-
الإنجليزية
Assessment for Data Analysis and Visualization Foundations
This course is the final step in the Data Analysis and Visualization Foundations Specialization. It contains a graded final examination that covers content from three courses: Introduction to Data Analytics, Excel Basics for Data Analysis, and Data Visualization and Dashboards with Excel and Cognos. From the Introduction to Data Analytics course, your understanding will be assessed on topics like the data ecosystem and the fundamentals of data analysis, covering tools for data gathering and data mining.
-
Course by
-
Self Paced
-
1 ساعات
-
الإنجليزية
Check Point Jump Start: Harmony Mobile
Harmony Mobile is the first mobile threat solution among the industry's top leading vendors to prevent the download of malicious files to mobile devices. With a staggering rise in mobile-related attacks, Check Point Harmony Mobile customers can rest assured knowing that their critical business assets remain protected from even the most sophisticated attacks targeting their workforce via mobile devices.
-
Course by
-
Self Paced
-
1 ساعات
-
الإنجليزية