


Generative AI for Business Leaders
Advertising with Meta
How Google does Machine Learning


دوراتنا

Data Visualization Capstone
Data visualization is a critical skill for anyone that routinely using quantitative data in his or her work - which is to say that data visualization is a tool that almost every worker needs today. One of the critical tools for data visualization today is the R statistical programming language. Especially in conjunction with the tidyverse software packages, R has become an extremely powerful and flexible platform for making figures, tables, and reproducible reports.
-
Course by

-
 Self Paced
-
 22 ساعات
-
 الإنجليزية
Designing Engaging Dashboards for Healthcare Analytics
Introduces processes and design principles for creating meaningful displays of information that support effective business decision-making. Studies how to collect and process data; create visualizations (both static and interactive); and use them to provide insight into a problem, situation, or opportunity. Introduces methods to critique visualizations along with ways to answer the elusive question: “What makes a visualization effective?” Discusses the challenges of making data understandable across a wide range of audiences.
-
Course by
-
Self Paced
-
16 ساعات
-
الإنجليزية

Google Ads for Beginners
In this 2-hour long tutorial, you will learn how to get started with Google Search Ads and create successful campaigns to reach new customers and grow your business. We'll work on Google Ads, Google's online advertising platform. You will drive qualified traffic, or best-fit customers to your business while they're searching on Google, for products and services like the ones that you offer.
-
Course by
-
Self Paced
-
3 ساعات
-
الإنجليزية
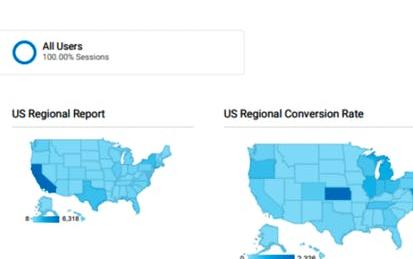
Building Custom Regional Reports with Google Analytics
In this 2 hours project you will learn how to build custom regional reports with Google Analytics. You will familiarize with Google Analytics and its usage, create a marketing custom regional dashboard with table and graph widgets, customize a standard geo report and scheduled the report you have designed to be sent monthly via email to a distributed regional marketing team.
-
Course by
-
Self Paced
-
3 ساعات
-
الإنجليزية
Create a Sales Dashboard using Power BI
In this 1 hour long project, you will build an attractive and eye-catching sales dashboard using Power BI in a black and blue theme that will make your audience go "wow". We will begin this guided project by importing data. We will then create bar charts and pie charts to visualize the sales data and then position the graphs on the dashboard. In the final tasks, we will create interactive maps to visualize sales data by countries and markets. By the end of this course, you will be confident in creating beautiful dashboards with many different kinds of visualizations.
-
Course by
-
Self Paced
-
2 ساعات
-
الإنجليزية

How to Schedule Posts to Multiple Platforms using Hootsuite
In this hands on guided course, you will learn about Hootsuite, a social media management platform and you will learn how we can schedule posts to different social media platforms. So by the end of this course, you will learn to use the Hootsuite platform, you will learn to publish posts across your various social media sites through one centralized location, you will explore various functionality of the Hootsuite dashboard and you will also learn how we can use Hootsuite to automate the social media posts
-
Course by
-
Self Paced
-
3 ساعات
-
الإنجليزية
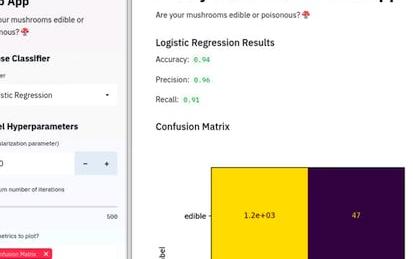
Build a Machine Learning Web App with Streamlit and Python
Welcome to this hands-on project on building your first machine learning web app with the Streamlit library in Python. By the end of this project, you are going to be comfortable with using Python and Streamlit to build beautiful and interactive ML web apps with zero web development experience! We are going to load, explore, visualize and interact with data, and generate dashboards in less than 100 lines of Python code!
-
Course by
-
Self Paced
-
3 ساعات
-
الإنجليزية
Build Dashboards in Power BI
In this project, you will create a Dashboard in Power BI. You will get data to bring into a model, build several reports, generate informative charts from each report, then choose powerful visuals to highlight on a Dashboard. Your new skills will help you efficiently summarize important information on a one-page dashboard with visual data.
-
Course by
-
Self Paced
-
3 ساعات
-
الإنجليزية
Using Collaborate for Version-Control in Unity 2021
Version-Control is vital in any software-development project. Even when working alone, it's important to be able to retrieve previous version of files or even a previous status of the whole project, in case of corruption or simply making too many bad choices to undo with Ctrl+Z.
Unity Collaborate is a free tool that helps manage updates and keep track of file-versions. It's free for teams of up to three people, is integrated in the Unity Editor and has a browser-based Dashboard for a top-level view.
-
Course by
-
Self Paced
-
2 ساعات
-
الإنجليزية

Reports, Dashboards, and Customer Success in Salesforce
The fourth course in the Salesforce Sales Operations Professional Certificate — Reports, Dashboards, and Customer Success in Salesforce — is for anyone who is curious about entry level sales roles that require foundational skills in Salesforce, the sales operations specialist role specifically, how to use tools in Salesforce to improve customer service at a business, how to leverage data in Salesforce to improve the overall performance of a sales team, and the path to becoming a Salesforce administrator. This fourth course goes into more depth on how a sales operations specialist would use Sa
-
Course by
-
Self Paced
-
31 ساعات
-
الإنجليزية

AI Workflow: Data Analysis and Hypothesis Testing
This is the second course in the IBM AI Enterprise Workflow Certification specialization. You are STRONGLY encouraged to complete these courses in order as they are not individual independent courses, but part of a workflow where each course builds on the previous ones. In this course you will begin your work for a hypothetical streaming media company by doing exploratory data analysis (EDA). Best practices for data visualization, handling missing data, and hypothesis testing will be introduced to you as part of your work. You will learn techniques of estimation
-
Course by
-
Self Paced
-
11 ساعات
-
الإنجليزية

Data Management with Databricks: Big Data with Delta Lakes
In this 2-hour guided project, "Data Management with Databricks: Big Data with Delta Lakes" you will collaborate with the instructor to achieve the following objectives: 1-Create Delta Tables in Databricks and write data to them. Gain hands-on experience in setting up and managing Delta Tables, a powerful data storage format optimized for performance and reliability. 2-Transform a Delta table using Python and leverage SQL to query the data for creating a comprehensive dashboard.
-
Course by
-
Self Paced
-
3 ساعات
-
الإنجليزية

Publishing Visualizations in R with Shiny and flexdashboard
Data visualization is a critical skill for anyone that routinely using quantitative data in his or her work - which is to say that data visualization is a tool that almost every worker needs today. One of the critical tools for data visualization today is the R statistical programming language. Especially in conjunction with the tidyverse software packages, R has become an extremely powerful and flexible platform for making figures, tables, and reproducible reports.
-
Course by
-
Self Paced
-
12 ساعات
-
الإنجليزية
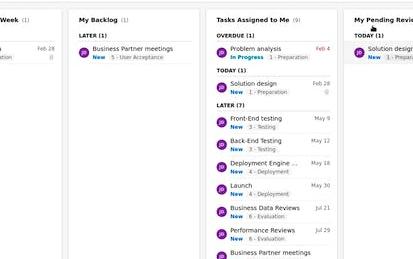
Create and manage a project dashboard with Wrike
In this 2.5-hour long project-based course, you will learn how to create and manage custom dashboards in Wrike to plan, execute and track both your personal work, team actions and multiple projects. You will use system and custom widgets, and create widgets directly from your tasks filtered list views.
-
Course by
-
Self Paced
-
3 ساعات
-
الإنجليزية

Salesforce Capstone: Organization Integration
In Salesforce Capstone: Organization Integration, the final course of the Salesforce Fundamentals Specialization, learners will complete the Business Administration Specialist Superbadge as their main project. This project asks learners to combine all the skills and knowledge areas that they have collected from the previous three courses.
-
Course by
-
Self Paced
-
7 ساعات
-
الإنجليزية

Build an E-commerce Dashboard with Figma
This course runs on Coursera's hands-on project platform called Rhyme. On Rhyme, you do projects in a hands-on manner in your browser. You will get instant access to pre-configured cloud desktops containing all of the software and data you need for the project. Everything is already set up directly in your Internet browser so you can just focus on learning. For this project, you’ll get instant access to a cloud desktop with Figma pre-installed.
Prerequisites:
In order to be successful in this project, you should be familiar with how to use basic commands on a mac or a PC.
Notes:
-
Course by
-
Self Paced
-
3 ساعات
-
الإنجليزية

How to create Social Media graphics using Canva
In this 1-hour long project-based course, you will learn how to create different Social Media graphics using Canva. We will use the Canva platform to create social media graphics using built-in templates and also from the scratch. This course includes Canva introduction, exploration of Canva dashboard, you will learn to use different elements from Canva, creation of social media posts using built-in templates, and from the scratch.
-
Course by
-
Self Paced
-
3 ساعات
-
الإنجليزية

Create a Project Management Dashboard using Bitrix24
In this 1 hour long, project based course you will learn how to set up a project management dashboard using the Bitrix24 free plan Note: This course works best for learners who are based in the North America region. We’re currently working on providing the same experience in other regions.
-
Course by
-
Self Paced
-
2 ساعات
-
الإنجليزية

Deploy and Maintain Power BI Assets and Capstone project
This course forms part of the Microsoft Power BI Analyst Professional Certificate. This Professional Certificate consists of a series of courses that offers a good starting point for a career in data analysis using Microsoft Power BI. In this course, you’ll learn how to deploy and maintain assets in Power BI. Through hands-on exercises, you’ll explore the process of creating, implementing, and managing Power BI workspaces.You’ll also implement security and monitoring to protect data in organizations.
-
Course by
-
Self Paced
-
4 ساعات
-
الإنجليزية

Create a Professional Automated Landing Page using Mailchimp
In this 1-hour long project-based course, you will learn how to design a professional landing page with a lead magnet to collect email addresses from scratch. We will then use the Email Automation feature from Mailchimp to send an automated email with an option to download the Free lead magnet and a Call to Action to join a webinar where a marketer can then sell premium products. This lead generation strategy is highly effective with really high conversion rates if done right. This guided project is beginner-friendly.
-
Course by
-
Self Paced
-
2 ساعات
-
الإنجليزية

Get Started with Wrike
Wrike is a versatile and customizable project management software that enables teams to coordinate tasks, track workflows and allows for easy and dynamic communication between team members. By the end of this project, you will learn about the utility of this digital project management tool, how to set up an account on Wrike and invite users to your workspace. You will familiarize yourself with the dashboard organization, learn how to create spaces, folders and projects, as well as creating tasks within a project.
-
Course by
-
Self Paced
-
3 ساعات
-
الإنجليزية

Analytics as a Service for Data Sharing Partners
This is a self-paced lab that takes place in the Google Cloud console. In this lab you will learn how Authorized Views in BigQuery can be shared and consumed to create customer-specific dashboards.
-
Course by
-
Self Paced
-
1 ساعات
-
الإنجليزية
How to Save Canva Designs to Mailchimp
In this project-based course, you will learn to create different designs using Canva and you will learn to integrate Canva with the Mailchimp platform. You will then learn to save Canva designs to MailChimp and not only these you will also learn how you can make use of those saved designs on an email campaign in Mailchimp as an additional tutorial. This course includes Canva Introduction, Exploration of Canva Dashboard, creating designs using Canva to be stored and used in Mailchimp, and creating an email campaign.
-
Course by
-
Self Paced
-
3 ساعات
-
الإنجليزية
Dashboarding and Deployment
This course will take you through the various parts of analytical dashboarding: from best practices for designing a dashboard, creating a unified analytical environment, to deploying and publishing visualizations. We will briefly discuss the advanced visualization techniques and you will develop an information layout of the biggest gainers and losers in the financial markets and compare those movements to the economic data as your capstone project.
-
Course by
-
Self Paced
-
9 ساعات
-
الإنجليزية
Looker Data Explorer - Qwik Start
This is a Google Cloud Self-Paced Lab. In this lab, you will create a series of visualizations from the Airports and Flights datasets and save them to a dashboard in Looker.
-
Course by
-
Self Paced
-
1 ساعات
-
الإنجليزية