


Generative AI for Business Leaders
Advertising with Meta
How Google does Machine Learning


دوراتنا
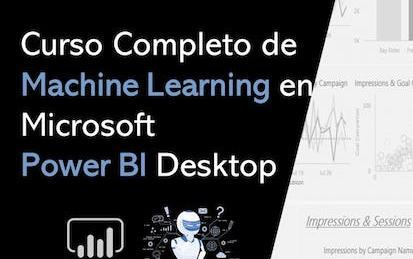
Curso Completo de Machine Learning en Microsoft Power BI
Este proyecto es un curso práctico y efectivo para aprender a integrar modelos de Machine Learning en tus dashboards de Power BI Desktop. Aprenderás, de manera practica y efectiva a generar y evaluar diferentes tipos de modelos de ML como: clasificación, regresión, reglas de asociación, clustering y detección de anomalías.
-
Course by

-
 Self Paced
-
 2 ساعات
-
 الإسبانية

Procesamiento del lenguaje natural con Python y Power BI
Este proyecto es un curso práctico y efectivo para aprender acerca del Procesamiento Natural del Lenguaje, centrándote en la parte de Topic Modelling. Aprenderas a como analizar tus textos mediante Python y Pycaret. También aprenderás a añadir capacidades de NLP a tus dashboards en Power BI.
-
Course by
-
Self Paced
-
3 ساعات
-
الإسبانية
Automated Machine Learning en Power BI Clasificación
Este proyecto es un curso práctico y efectivo para aprender todo lo que necesitas saber acerca de como crear e integrar modelos de clasificación de autoML en Power BI. No solo aprenderás, de manera practica, a generar y evaluar los modelos de clasificación de autoML. Sino que además aprenderás a integrarlos y a utilizarlos dentro de tus dashboards de Power BI.
-
Course by
-
Self Paced
-
3 ساعات
-
الإسبانية
Diseño y optimización de un modelo de datos en Power BI
El modelo de datos es una de las partes clave para el buen funcionamiento del dashboard de Power BI. Este modelo de datos debe ser correcto y debe estar optimizado, de lo contrario obtendremos resultados incorrectos en los gráficos y el informe tardara mucho tiempo en cargar.
Por ello, en este curso aprenderemos todo lo relacionado con el desarrollo de un correcto modelo de datos, así como las técnicas para optimizarlo.
-
Course by
-
Self Paced
-
3 ساعات
-
الإسبانية

Analíticas en Redes Sociales
En este último curso de la Especialidad “Analíticas de marketing Digital”, tendrás la oportunidad de adentrarte en el mundo de las diversas redes sociales, conociendo cómo y cuándo es recomendable utilizarlas, aprendiendo a administrar sus indicadores a través de KPIs y dashboards. Cerraremos el curso con la importancia de hacer Social Listening y el futuro de las redes sociales. Los principales objetivos que perseguimos en este curso son los siguientes: 1. Conocer las más importantes plataformas de redes sociales de la actualidad, entendiendo sus targets y principales usos. 2. Analizar los p
-
Course by
-
Self Paced
-
الإسبانية
Automated Machine Learning en Microsoft Power BI
Este proyecto es un curso práctico y efectivo para aprender todo lo que necesitas saber acerca de como crear e integrar modelos de autoML en Power BI. No solo aprenderás, de manera practica, a generar y evaluar los modelos. Sino que además aprenderás a integrar y utilizarlos dentro de tus dashboards de Power BI.
-
Course by
-
Self Paced
-
3 ساعات
-
الإسبانية

Operaciones de ventas de Salesforce
The Salesforce economy will create more than $1 trillion in new revenue and 4.2 million jobs between 2019 and 2024. Developed in partnership with Trailhead — Salesforce's official learning platform — this certificate aims to teach you the foundational skills in Salesforce that will prepare you for a variety of entry-level sales roles, including the sales operations specialist position. This certificate is designed for beginners. No previous experience in Salesforce, sales, or CRM is necessary to be successful.
-
Course by
-
Self Paced
-
الإسبانية

Erste Schritte mit R Markdown
Dieses Projekt richtet sich an Anfänger, die die Programmier- und Analysesprache R nutzen möchten, um reproduzierbare Analysedokumente zu erstellen.
-
Course by
-
Self Paced
-
3 ساعات
-
ألماني
Business Analytics
Hoy en día los datos son fundamentales en el entorno empresarial para tener una visión global de la situación de una organización y poder tomar mejores decisiones. En este contexto, el Big Data es un sector en auge en múltiples ámbitos que nos abre distintas oportunidades laborales, como el rol de analista de datos (Data Analyst). Este curso es una introducción al análisis de datos con un enfoque empresarial, centrado en la relevancia de basar la toma de decisiones estratégicas en el conocimiento que nos aportan los datos.
-
Course by
-
Self Paced
-
الإسبانية

Business Intelligence con la Product Suite di Tableau
Questo corso è rivolto a tutti coloro che hanno maturato una conoscenza solida di Tableau. Dopo aver imparato a analizzare dati e costruire visualizzazioni è arrivato il momento di approfondire la conoscenza della Business Intelligence (BI) e andare oltre Tableau. La week 1 è dedicata alle Dashboard e alle Story.
-
Course by
-
Self Paced
-
25 ساعات
-
الإيطالية
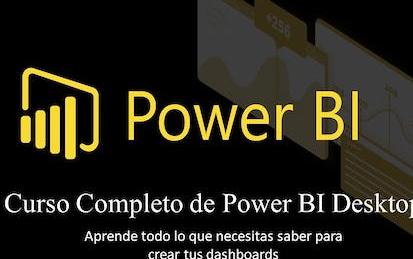
Curso Completo de Power BI Desktop
Este proyecto es un curso práctico y efectivo para aprender a programar Power BI desde cero. Te permitirá adquirir los conocimientos de Power BI Desktop de manera práctica y efectiva. También te permitirá aprender las nociones básicas de DAX y a generar tu propio dashboard.
-
Course by
-
Self Paced
-
3 ساعات
-
الإسبانية

Build a website using Wix Artificial Design Intelligence
In this 1.5-hour long project-based course, you will learn how to build a stunning and unique website using Wix Artificial Design Intelligence using different combinations of layouts, themes, fonts, designs & sections. You will also be able to communicate with your customers via Inbox & chat available in Wix's dashboard. Wix ADI is one of the first-ever AI solutions for website design and creation. Wix is the leader in drag & drop web design and we are going to allow Wix’s Artificial Intelligence technology to create a “tailored” website for each of us.
-
Course by
-
Self Paced
-
2 ساعات
-
الإنجليزية

How to create a marketing analytics dashboard using Hubspot
By the end of this project, you will learn how to create a customized report dashboard in Hubspot, will learn how to add existing marketing reports, adjust the view of the marketing dashboard.
-
Course by
-
Self Paced
-
3 ساعات
-
الإنجليزية

Intégrer des applications dans votre Dashboard Hootsuite
À la fin de ce projet, vous aurez toutes les compétences de base pour intégrer des applications dans votre Dashboard Hootsuite. Vous serez en mesure de découvrir les différents types d’applications que vous pouvez installer et vous pourrez les intégrer facilement et rapidement à votre tableau de bord sur Hootsuite.
-
Course by
-
Self Paced
-
4 ساعات
-
الفرنسية

Analizando Redes Sociales en Power BI: Campañas de Instagram
El Proyecto Guiado "Analizando Redes Sociales en Power BI: Campañas de Instagram" es para Construir un dashboard de datos que nos permita analizar de forma efectiva la data obtenida y obtener indicadores relevantes de marketing de Instagram que impacten en el negocio.
-
Course by
-
Self Paced
-
2 ساعات
-
الإسبانية
Measure and Optimize Social Media Marketing Campaigns
This course provides you with the skills to optimize your social media marketing efforts. Learn to evaluate and interpret the results of your advertising campaigns. Learn how to assess advertising effectiveness through lift studies and optimize your campaigns with split testing. Understand how advertising effectiveness is measured across platforms and devices, learn how to evaluate the ROI of your marketing, and master how to communicate your social media marketing results to others in the company.
-
Course by
-
Self Paced
-
19 ساعات
-
الإنجليزية

Share Data Through the Art of Visualization
This is the sixth course in the Google Data Analytics Certificate. You’ll learn how to visualize and present your data findings as you complete the data analysis process. This course will show you how data visualizations, such as visual dashboards, can help bring your data to life. You’ll also explore Tableau, a data visualization platform that will help you create effective visualizations for your presentations.
-
Course by
-
Self Paced
-
24 ساعات
-
الإنجليزية

Excel Power Tools for Data Analysis
Welcome to Excel Power Tools for Data Analysis. In this four-week course, we introduce Power Query, Power Pivot and Power BI, three power tools for transforming, analysing and presenting data. Excel's ease and flexibility have long made it a tool of choice for doing data analysis, but it does have some inherent limitations: for one, truly "big" data simply does not fit in a spreadsheet and for another, the process of importing and cleaning data can be a repetitive, time-consuming and error-prone.
-
Course by
-
15 ساعات
-
الإنجليزية

Data Visualization and Dashboards with Excel and Cognos
Learn how to create data visualizations and dashboards using spreadsheets and analytics tools. This course covers some of the first steps for telling a compelling story with your data using various types of charts and graphs. You'll learn the basics of visualizing data with Excel and IBM Cognos Analytics without having to write any code. You'll start by creating simple charts in Excel such as line, pie and bar charts. You will then create more advanced visualizations with Treemaps, Scatter Charts, Histograms, Filled Map Charts, and Sparklines.
-
Course by
-
Self Paced
-
24 ساعات
-
الإنجليزية

Data Visualization in Excel
In an age now driven by "big data", we need to cut through the noise and present key information in a way that can be quickly consumed and acted upon making data visualization an increasingly important skill. Visualizations need to not only present data in an easy to understand and attractive way, but they must also provide context for the data, tell a story, achieving that fine balance between form and function. Excel has many rivals in this space, but it is still an excellent choice, particularly if it's where your data resides.
-
Course by
-
Self Paced
-
18 ساعات
-
الإنجليزية
Business Intelligence Concepts, Tools, and Applications
This is the fourth course in the Data Warehouse for Business Intelligence specialization. Ideally, the courses should be taken in sequence. Effectively and efficiently mining data is the very center of any modern business’s competitive strategy, and a data warehouse is a core component of this data mining. The ability to quickly look back at early trends and have the accurate data – properly formatted – is essential to good decision making. By enabling this historical overview, a data warehouse allows decision makers to learn from past trends and challenges.
-
Course by
-
Self Paced
-
22 ساعات
-
الإنجليزية
Excel Skills for Business: Advanced
Spreadsheet software remains one of the most ubiquitous pieces of software used in workplaces around the world. Learning to confidently operate this software means adding a highly valuable asset to your employability portfolio. Across the globe, millions of job advertisements requiring Excel skills are posted every day.
-
Course by
-
Self Paced
-
25 ساعات
-
الإنجليزية

Increasing Real Estate Management Profits: Harnessing Data Analytics
In this final course you will complete a Capstone Project using data analysis to recommend a method for improving profits for your company, Watershed Property Management, Inc. Watershed is responsible for managing thousands of residential rental properties throughout the United States. Your job is to persuade Watershed’s management team to pursue a new strategy for managing its properties that will increase their profits.
-
Course by
-
Self Paced
-
23 ساعات
-
الإنجليزية

Data Visualization with Tableau Project
In this project-based course, you will follow your own interests to create a portfolio worthy single-frame viz or multi-frame data story that will be shared on Tableau Public. You will use all the skills taught in this Specialization to complete this project step-by-step, with guidance from your instructors along the way. You will first create a project proposal to identify your goals for the project, including the question you wish to answer or explore with data. You will then find data that will provide the information you are seeking.
-
Course by
-
Self Paced
-
12 ساعات
-
الإنجليزية
Creating Dashboards and Storytelling with Tableau
In this course, you’ll learn how to create Tableau dashboards that connect data to decision-making. Starting with stakeholder planning and data requirements, you’ll define goals, success metrics, and key questions. Then, you’ll clean and prepare a real-world tech salary dataset using Tableau’s filtering, aliasing, and data type tools. You’ll turn these insights into impactful dashboards using calculated fields, grouping, and interactivity.
-
Course by
-
Self Paced
-
15 ساعات
-
الإنجليزية