


Generative AI for Business Leaders
Advertising with Meta
How Google does Machine Learning


دوراتنا
Build a Data Science Web App with Streamlit and Python
Welcome to this hands-on project on building your first data science web app with the Streamlit library in Python. By the end of this project, you are going to be comfortable with using Python and Streamlit to build beautiful and interactive web apps with zero web development experience! We are going to load, explore, visualize and interact with data, and generate dashboards in less than 100 lines of Python code!
Prior experience with writing simple Python scripts and using pandas for data manipulation is recommended.
-
Course by

-
 Self Paced
-
 2 ساعات
-
 الإنجليزية

Identifying Patient Populations
This course teaches you the fundamentals of computational phenotyping, a biomedical informatics method for identifying patient populations. In this course you will learn how different clinical data types perform when trying to identify patients with a particular disease or trait. You will also learn how to program different data manipulations and combinations to increase the complexity and improve the performance of your algorithms.
-
Course by
-
Self Paced
-
13 ساعات
-
الإنجليزية
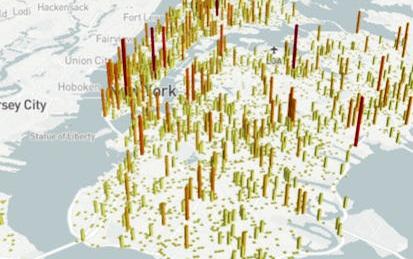
Data Visualization using dplyr and ggplot2 in R
Welcome to this project-based course Data Visualization using ggplot2 and dplyr in R. In this project, you will learn how to manipulate data with the dplyr package and create beautiful plots using the ggplot2 package in R. By the end of this 2-hour long project, you will understand how to use different dplyr verbs such as the select verb, filter verb, arrange verb, mutate verb, summarize verb, and the group_by verb to manipulate the gapminder dataset.
-
Course by
-
Self Paced
-
3 ساعات
-
الإنجليزية

Geographical Information Systems - Part 1
This course is organized into two parts presenting the theoretical and practical foundations of geographic information systems (GIS). - Together theses courses constitute an introduction to GIS and require no prior knowledge. - By following this introduction to GIS you will quickly acquire the basic knowledge required to create spatial databases and produce high-quality maps and cartographic representations. - This is a practical course and is based on free, open-source software, including QGIS. If you study or work in the fields of land management or the analysis of geographically distributed
-
Course by
-
Self Paced
-
20 ساعات
-
الإنجليزية

Deploying Machine Learning Models
In this course we will learn about Recommender Systems (which we will study for the Capstone project), and also look at deployment issues for data products. By the end of this course, you should be able to implement a working recommender system (e.g.
-
Course by
-
Self Paced
-
11 ساعات
-
الإنجليزية
Getting Started with Tidyverse
In this project, you will learn about Tidyverse, a system of packages for data manipulation, exploration and visualization in the R programming language. R is a computer programming language, and it is also an open-source software often used among data scientists, statisticians, and data miners in their everyday work with data sets.
-
Course by
-
Self Paced
-
4 ساعات
-
الإنجليزية

Data Manipulation in RPA
The Data Manipulation in RPA course will provide knowledge about Variables, Arguments, and Data Manipulation. It will also introduce you to Variables and Arguments, their types, and their application in automation projects. In the later part of the course, you will learn about data manipulation in Studio. You will also learn about the different methods and operations performed on different data types and their usage in automation projects. Building on each concept, there will be demonstration videos that will explain these operations and methods.
-
Course by
-
Self Paced
-
9 ساعات
-
الإنجليزية
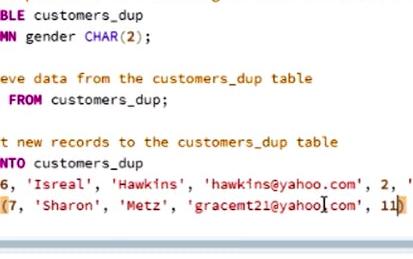
Performing Data Definition and Manipulation in SQL
In this 2-hour long project-based course, you will learn how to use SQL data definition statements for various data definition tasks and how to use SQL data manipulation statements for data manipulation tasks such as updating records in a table. In addition, you will learn how to upload a CSV file into a database using PostgreSQL.
-
Course by
-
Self Paced
-
3 ساعات
-
الإنجليزية

AI Workflow: Enterprise Model Deployment
This is the fifth course in the IBM AI Enterprise Workflow Certification specialization. You are STRONGLY encouraged to complete these courses in order as they are not individual independent courses, but part of a workflow where each course builds on the previous ones. This course introduces you to an area that few data scientists are able to experience: Deploying models for use in large enterprises. Apache Spark is a very commonly used framework for running machine learning models. Best practices for using Spark will be covered in this course. Best practices for
-
Course by
-
Self Paced
-
9 ساعات
-
الإنجليزية

Geographical Information Systems - Part 2
This course is the second part of a course dedicated to the theoretical and practical bases of Geographic Information Systems (GIS). It offers an introduction to GIS that does not require prior computer skills. It gives the opportunity to quickly acquire the basics that allow you to create spatial databases and produce geographic maps. This is a practical course that relies on the use of free Open Source software (QGIS, Geoda). In the first part of the course (Geographical Information Systems - Part 1), you explored the basics of land digitization and geodata storage.
-
Course by
-
Self Paced
-
10 ساعات
-
الإنجليزية
App Design and Development for iOS
In App Design and Development for iOS, the third course of the iOS App Development with Swift specialization, you will be developing foundational programming skills to support graphical element presentation and data manipulation from basic functions through to advanced processing. You will continue to build your skill set to use and apply core graphics, touch handling and gestures, animations and transitions, alerts and actions as well as advanced algorithms, threading and more.
-
Course by
-
Self Paced
-
9 ساعات
-
الإنجليزية
Fundamental Tools of Data Wrangling
Data wrangling is a crucial step in the data analysis process, as it involves the transformation and preparation of raw data into a suitable format for analysis. The "Fundamental Tools for Data Wrangling" course is designed to provide participants with essential skills and knowledge to effectively manipulate, clean, and analyze data. Participants will be introduced to the fundamental tools commonly used in data wrangling, including Python, data structures, NumPy, and pandas.
-
Course by
-
Self Paced
-
27 ساعات
-
الإنجليزية
Data Manipulation at Scale: Systems and Algorithms
Data analysis has replaced data acquisition as the bottleneck to evidence-based decision making --- we are drowning in it. Extracting knowledge from large, heterogeneous, and noisy datasets requires not only powerful computing resources, but the programming abstractions to use them effectively.
-
Course by
-
Self Paced
-
20 ساعات
-
الإنجليزية
Build a Machine Learning Web App with Streamlit and Python
Welcome to this hands-on project on building your first machine learning web app with the Streamlit library in Python. By the end of this project, you are going to be comfortable with using Python and Streamlit to build beautiful and interactive ML web apps with zero web development experience! We are going to load, explore, visualize and interact with data, and generate dashboards in less than 100 lines of Python code!
-
Course by
-
Self Paced
-
3 ساعات
-
الإنجليزية

Where, Why, and How of Lambda Functions in Python
In this project we are going to learn about lambda expressions and it's application in python. We are going to start with what is Lambda expression and how we can define it, comparing lambda functions with regular functions in python and at the end we will learn how to use lambda functions for data manipulation and exploration in pandas. this guided-project is completely beginner friendly. you only need to have basic knowledge of python programming and some experience coding in Jupyter notebook environment.
-
Course by
-
Self Paced
-
2 ساعات
-
الإنجليزية

Data Warehousing for Business Intelligence
Evaluate business needs, design a data warehouse, and integrate and visualize data using dashboards and visual analytics. This Specialization covers data architecture skills that are increasingly critical across a broad range of technology fields. You’ll learn the basics of structured data modeling, gain practical SQL coding experience, and develop an in-depth understanding of data warehouse design and data manipulation. You’ll have the opportunity to work with large data sets in a data warehouse environment to create dashboards and Visual Analytics.
-
Course by
-
Self Paced
-
الإنجليزية

Database Design and Operational Business Intelligence
The goal of this specialization is to provide a comprehensive and holistic view of business intelligence and its enabling technologies, including relational databases, data warehousing, descriptive statistics, data mining, and visual analytics. Through this series of courses, you will explore relational database design, data manipulation through Extract/Transform/Load (ETL), gaining actionable insight through data analytics, data-based decision support, data visualization, and practical, hands-on experience with real-world business intelligence tools.
-
Course by
-
Self Paced
-
الإنجليزية

IBM Data Analyst
Prepare for a career in the high-growth field of data analytics. In this program, you’ll learn in-demand skills like Python, Excel, and SQL to get job-ready in as little as 4 months. Data analysis is the process of collecting, storing, modeling, and analyzing data that can inform executive decision-making, and the demand for skilled data analysts has never been greater. This program will teach you the foundational data skills employers are seeking for entry-level data analytics roles.
-
Course by
-
التعلم الذاتي
-
الإنجليزية

Mastering Software Development in R
R is a programming language and a free software environment for statistical computing and graphics, widely used by data analysts, data scientists and statisticians. This Specialization covers R software development for building data science tools.
-
Course by
-
Self Paced
-
الإنجليزية

Create Interactive Dashboards with Streamlit and Python
Welcome to this hands-on project on building your first interactive, data dashboard with the Streamlit library in Python. By the end of this project, you are going to be comfortable with using Python and Streamlit to build beautiful and interactive dashboards and web apps, all with zero web development experience!
-
Course by
-
Self Paced
-
3 ساعات
-
الإنجليزية

Use Tableau for Your Data Science Workflow
This specialization covers the foundations of visualization in the context of the data science workflow. Through the application of interactive visual analytics, students will learn how to extract structure from historical data and present key points through graphical storytelling. Additional topics include data manipulation, visualization foundations, audience identification, ethical considerations, dashboard creation, and report generation. Demonstrations of the basic visualization techniques used in Tableau will be included with a hands-on project.
-
Course by
-
Self Paced
-
الإنجليزية
Data Understanding and Visualization
The "Data Understanding and Visualization" course provides students with essential statistical concepts to comprehend and analyze datasets effectively. Participants will learn about central tendency, variation, location, correlation, and other fundamental statistical measures. Additionally, the course introduces data visualization techniques using Pandas, Matplotlib, and Seaborn packages, enabling students to present data visually with appropriate plots for accurate and efficient communication. Learning Objectives: 1.
-
Course by
-
25 ساعات
-
الإنجليزية

Data Analytics in the Public Sector with R
Every government entity collects and stores millions of data points to perform administrative and legislative duties, allocate resources, and make decisions. Professionals in the public sector need the necessary skills to accurately interpret and inform administrators and policymakers about the meaning behind these data. This Specialization will equip you with fundamental technical skills using the R programming language to gather, manipulate, analyze, visualize, and interpret data to inform public policy and public administrative functions.
-
Course by
-
Self Paced
-
الإنجليزية

Neuroscience and Neuroimaging
This specialization combines the strength of 4 different neuroscience courses into a cohesive learning experience. Taught by Johns Hopkins University, it begins with fundamental neuroscience concepts for neuroimaging. Neuroimaging methods are used with increasing frequency in clinical practice and basic research.
-
Course by
-
Self Paced
-
الإنجليزية
Data Analysis with OpenAI API: Save time with GenAI
In this 2-hour project-based course, you will embark on an exciting journey as a mid-level data analyst at TechTrends, a thriving e-commerce company specializing in electronic gadgets and accessories. Your mission is to leverage the power of cutting-edge AI technology, specifically the OpenAI API's GPT-4, to extract invaluable insights from the treasure trove of sales data at TechTrends. As the driving force behind data-driven decisions that transcend traditional boundaries, you will delve into the world of data analysis and insight extraction.
-
Course by
-
Self Paced
-
2 ساعات
-
الإنجليزية