


Generative AI for Business Leaders
Advertising with Meta
How Google does Machine Learning


دوراتنا

Database Design and Operational Business Intelligence
The goal of this specialization is to provide a comprehensive and holistic view of business intelligence and its enabling technologies, including relational databases, data warehousing, descriptive statistics, data mining, and visual analytics. Through this series of courses, you will explore relational database design, data manipulation through Extract/Transform/Load (ETL), gaining actionable insight through data analytics, data-based decision support, data visualization, and practical, hands-on experience with real-world business intelligence tools.
-
Course by

-
 Self Paced
-
 الإنجليزية

Data Warehousing for Business Intelligence
Evaluate business needs, design a data warehouse, and integrate and visualize data using dashboards and visual analytics. This Specialization covers data architecture skills that are increasingly critical across a broad range of technology fields. You’ll learn the basics of structured data modeling, gain practical SQL coding experience, and develop an in-depth understanding of data warehouse design and data manipulation. You’ll have the opportunity to work with large data sets in a data warehouse environment to create dashboards and Visual Analytics.
-
Course by
-
Self Paced
-
الإنجليزية

Where, Why, and How of Lambda Functions in Python
In this project we are going to learn about lambda expressions and it's application in python. We are going to start with what is Lambda expression and how we can define it, comparing lambda functions with regular functions in python and at the end we will learn how to use lambda functions for data manipulation and exploration in pandas. this guided-project is completely beginner friendly. you only need to have basic knowledge of python programming and some experience coding in Jupyter notebook environment.
-
Course by
-
Self Paced
-
 2 ساعات
-
الإنجليزية
Build a Data Science Web App with Streamlit and Python
Welcome to this hands-on project on building your first data science web app with the Streamlit library in Python. By the end of this project, you are going to be comfortable with using Python and Streamlit to build beautiful and interactive web apps with zero web development experience! We are going to load, explore, visualize and interact with data, and generate dashboards in less than 100 lines of Python code!
Prior experience with writing simple Python scripts and using pandas for data manipulation is recommended.
-
Course by
-
Self Paced
-
2 ساعات
-
الإنجليزية

Data Manipulation at Scale: Systems and Algorithms
Data analysis has replaced data acquisition as the bottleneck to evidence-based decision making --- we are drowning in it. Extracting knowledge from large, heterogeneous, and noisy datasets requires not only powerful computing resources, but the programming abstractions to use them effectively.
-
Course by
-
Self Paced
-
20 ساعات
-
الإنجليزية
Fundamental Tools of Data Wrangling
Data wrangling is a crucial step in the data analysis process, as it involves the transformation and preparation of raw data into a suitable format for analysis. The "Fundamental Tools for Data Wrangling" course is designed to provide participants with essential skills and knowledge to effectively manipulate, clean, and analyze data. Participants will be introduced to the fundamental tools commonly used in data wrangling, including Python, data structures, NumPy, and pandas.
-
Course by
-
Self Paced
-
27 ساعات
-
الإنجليزية
Doing More with SAS Programming
This course is for business analysts and SAS programmers who want to learn data manipulation techniques using the SAS DATA step and procedures to access, transform, and summarize data.
-
Course by
-
Self Paced
-
25 ساعات
-
الإنجليزية

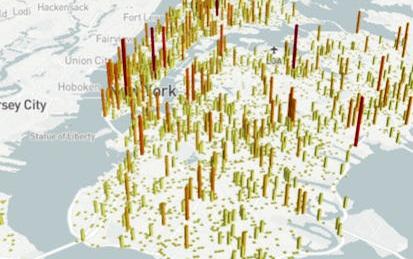
Basic Data Processing and Visualization
This is the first course in the four-course specialization Python Data Products for Predictive Analytics, introducing the basics of reading and manipulating datasets in Python. In this course, you will learn what a data product is and go through several Python libraries to perform data retrieval, processing, and visualization. This course will introduce you to the field of data science and prepare you for the next three courses in the Specialization: Design Thinking and Predictive Analytics for Data Products, Meaningful Predictive Modeling, and Deploying Machine Learning Models.
-
Course by
-
Self Paced
-
11 ساعات
-
الإنجليزية
Introduction to Data Science in Python
This course will introduce the learner to the basics of the python programming environment, including fundamental python programming techniques such as lambdas, reading and manipulating csv files, and the numpy library. The course will introduce data manipulation and cleaning techniques using the popular python pandas data science library and introduce the abstraction of the Series and DataFrame as the central data structures for data analysis, along with tutorials on how to use functions such as groupby, merge, and pivot tables effectively.
-
Course by
-
Self Paced
-
35 ساعات
-
الإنجليزية