


Generative AI for Business Leaders
Advertising with Meta
How Google does Machine Learning


دوراتنا
Launching into Machine Learning
The course begins with a discussion about data: how to improve data quality and perform exploratory data analysis. We describe Vertex AI AutoML and how to build, train, and deploy an ML model without writing a single line of code. You will understand the benefits of Big Query ML. We then discuss how to optimize a machine learning (ML) model and how generalization and sampling can help assess the quality of ML models for custom training.
-
Course by

-
 Self Paced
-
 14 ساعات
-
 الإنجليزية
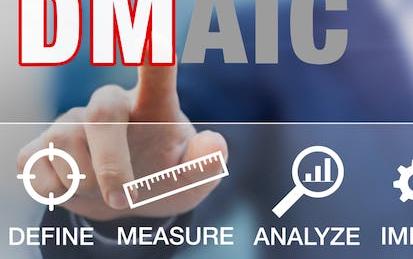
Six Sigma Advanced Define and Measure Phases
This course is for you if you are looking to dive deeper into Six Sigma or strengthen and expand your knowledge of the basic components of green belt level of Six Sigma and Lean. Six Sigma skills are widely sought by employers both nationally and internationally. These skills have been proven to help improve business processes and performance.
-
Course by
-
Self Paced
-
15 ساعات
-
الإنجليزية

Data Processing and Feature Engineering with MATLAB
In this course, you will build on the skills learned in Exploratory Data Analysis with MATLAB to lay the foundation required for predictive modeling. This intermediate-level course is useful to anyone who needs to combine data from multiple sources or times and has an interest in modeling. These skills are valuable for those who have domain knowledge and some exposure to computational tools, but no programming background.
-
Course by
-
Self Paced
-
20 ساعات
-
الإنجليزية

Managing Data Analysis
This one-week course describes the process of analyzing data and how to manage that process. We describe the iterative nature of data analysis and the role of stating a sharp question, exploratory data analysis, inference, formal statistical modeling, interpretation, and communication. In addition, we will describe how to direct analytic activities within a team and to drive the data analysis process towards coherent and useful results. This is a focused course designed to rapidly get you up to speed on the process of data analysis and how it can be managed.
-
Course by
-
Self Paced
-
9 ساعات
-
الإنجليزية

Predictive Modeling and Machine Learning with MATLAB
In this course, you will build on the skills learned in Exploratory Data Analysis with MATLAB and Data Processing and Feature Engineering with MATLAB to increase your ability to harness the power of MATLAB to analyze data relevant to the work you do. These skills are valuable for those who have domain knowledge and some exposure to computational tools, but no programming background.
-
Course by
-
Self Paced
-
22 ساعات
-
الإنجليزية
Introduction to Probability and Data with R
This course introduces you to sampling and exploring data, as well as basic probability theory and Bayes' rule. You will examine various types of sampling methods, and discuss how such methods can impact the scope of inference. A variety of exploratory data analysis techniques will be covered, including numeric summary statistics and basic data visualization. You will be guided through installing and using R and RStudio (free statistical software), and will use this software for lab exercises and a final project.
-
Course by
-
Self Paced
-
14 ساعات
-
الإنجليزية

Meaningful Marketing Insights
With marketers are poised to be the largest users of data within the organization, there is a need to make sense of the variety of consumer data that the organization collects. Surveys, transaction histories and billing records can all provide insight into consumers’ future behavior, provided that they are interpreted correctly. In Introduction to Marketing Analytics, we introduce the tools that learners will need to convert raw data into marketing insights.
-
Course by
-
Self Paced
-
10 ساعات
-
الإنجليزية

Predictive Modeling and Analytics
Welcome to the second course in the Data Analytics for Business specialization! This course will introduce you to some of the most widely used predictive modeling techniques and their core principles. By taking this course, you will form a solid foundation of predictive analytics, which refers to tools and techniques for building statistical or machine learning models to make predictions based on data. You will learn how to carry out exploratory data analysis to gain insights and prepare data for predictive modeling, an essential skill valued in the business.
-
Course by
-
11 ساعات
-
الإنجليزية