


Generative AI for Business Leaders
Advertising with Meta
How Google does Machine Learning


دوراتنا
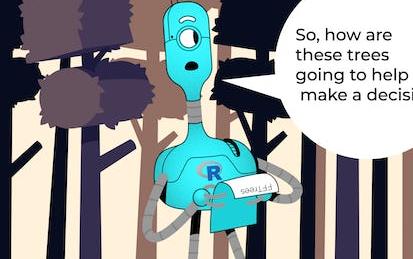
Machine Learning: Predict Poisonous Mushrooms using a Random Forest Model and the FFTrees Package in R
In this 1-hour long project-based course, you will learn how to complete a training and test set using an R function, practice looking at data distribution using R and ggplot2, Apply a Random Forest model to the data usi…
-
Course by

-
 Self Paced
-
 2 ساعات
-
 الإنجليزية

Predict Ideal Diamonds over Good Diamonds using a Random Forest using R
In this 1-hour long project-based course, you will learn how to (complete a training and test set using an R function, practice looking at data distribution using R and ggplot2, Apply a Random Forest model to the data, and examine the results using RMSE and a Confusion Matrix).
-
Course by
-
Self Paced
-
2 ساعات
-
الإنجليزية

Introducción a Data Science: Programación Estadística con R
Este curso te proporcionará las bases del lenguaje de programación estadística R, la lengua franca de la estadística, el cual te permitirá escribir programas que lean, manipulen y analicen datos cuantitativos. Te explicaremos la instalación del lenguaje; también verás una introducción a los sistemas base de gráficos y al paquete para graficar ggplot2, para visualizar estos datos.
-
Course by
-
Self Paced
-
الإسبانية
Datenvisualisierung mit ggplot2
Willkommen zu diesem projektbasierten Kurs über Datenvisualisierung mit `ggplot2` in R! Du wirst hier lernen, wie du wunderschöne und erkenntnisreiche Grafiken aus Data Frames in R erstellst. Das R-Paket `ggplot2` benutzt hierfür eine intuitive Grammatik, die deinen Denkprozess beim Erstellen der Visualisierung elegant abbildet.
Am Ende dieses zweistündigen Projekts wirst du in der Lage sein, intuitive, elegante und ansprechende Datenvisualisierungen eines beliebigen Datensatzes mithilfe des ggplot2-Pakets durchzuführen.
-
Course by
-
Self Paced
-
2 ساعات
-
ألماني

Data Visualization in R with ggplot2
Data visualization is a critical skill for anyone that routinely using quantitative data in his or her work - which is to say that data visualization is a tool that almost every worker needs today. One of the critical tools for data visualization today is the R statistical programming language. Especially in conjunction with the tidyverse software packages, R has become an extremely powerful and flexible platform for making figures, tables, and reproducible reports.
-
Course by
-
Self Paced
-
13 ساعات
-
الإنجليزية

Predict Gas Guzzlers using a Neural Net Model on the MPG Data Set
In this 1-hour long project-based course, you will learn how to (complete a training and test set using an R function, practice looking at data distribution using R and ggplot2, Apply a Neural Net model to the data, and examine the results using a Confusion Matrix.
Note: This course works best for learners who are based in the North America region. We’re currently working on providing the same experience in other regions.
-
Course by
-
Self Paced
-
3 ساعات
-
الإنجليزية

Publishing Visualizations in R with Shiny and flexdashboard
Data visualization is a critical skill for anyone that routinely using quantitative data in his or her work - which is to say that data visualization is a tool that almost every worker needs today. One of the critical tools for data visualization today is the R statistical programming language. Especially in conjunction with the tidyverse software packages, R has become an extremely powerful and flexible platform for making figures, tables, and reproducible reports.
-
Course by
-
Self Paced
-
12 ساعات
-
الإنجليزية
Predict Diabetes with a Random Forest using R
In this 1-hour long project-based course, you will learn how to (complete a training and test set using an R function, practice looking at data distribution using R and ggplot2, Apply a Random Forest model to the data, and examine the results using RMSE and a Confusion Matrix).
Note: This course works best for learners who are based in the North America region. We’re currently working on providing the same experience in other regions.
-
Course by
-
Self Paced
-
4 ساعات
-
الإنجليزية
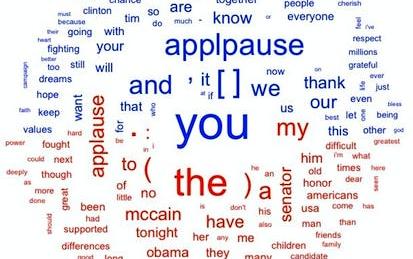
Exploratory Data Analysis with Textual Data in R / Quanteda
In this 1-hour long project-based course, you will learn how to explore presidential concession speeches by US presidential candidates over time, looking specifically at speech length and top words and examining variation by Democrat and Republican candidates. You will learn how to import textual data stored in raw text files, turn these files into a corpus (a collection of textual documents) and tokenize the text all using the software package quanteda.
-
Course by
-
Self Paced
-
3 ساعات
-
الإنجليزية
Data Visualization using dplyr and ggplot2 in R
Welcome to this project-based course Data Visualization using ggplot2 and dplyr in R. In this project, you will learn how to manipulate data with the dplyr package and create beautiful plots using the ggplot2 package in R. By the end of this 2-hour long project, you will understand how to use different dplyr verbs such as the select verb, filter verb, arrange verb, mutate verb, summarize verb, and the group_by verb to manipulate the gapminder dataset.
-
Course by
-
Self Paced
-
3 ساعات
-
الإنجليزية
Data Visualization with Plotly Express
Welcome to this project-based course on Data Visualization with Plotly Express. In this project, you will create quick and interactive data visualizations with Plotly Express: a high-level data visualization library in Python inspired by Seaborn and ggplot2. You will explore the various features of the in-built Gapminder dataset, and produce interactive, publication-quality graphs to augment analysis. This course runs on Coursera's hands-on project platform called Rhyme. On Rhyme, you do projects in a hands-on manner in your browser.
-
Course by
-
Self Paced
-
3 ساعات
-
الإنجليزية

Visualizing Data in the Tidyverse
Data visualization is a critical part of any data science project. Once data have been imported and wrangled into place, visualizing your data can help you get a handle on what’s going on in the data set. Similarly, once you’ve completed your analysis and are ready to present your findings, data visualizations are a highly effective way to communicate your results to others.
-
Course by
-
Self Paced
-
17 ساعات
-
الإنجليزية

Data Science: Visualization
Learn basic data visualization principles and how to apply them using ggplot2.
-
Course by

-
Self Paced
-
12
-
الإنجليزية

Using ggplot
In this project, you will learn about using ggplot, specifically ggplot2 (the latest version of ggplot). This program is a plotting package for the programming language R. R is a computer programming language, and it is also an open-source software often used among data scientists, statisticians, and data miners in their everyday work with data sets. The gg in ggplot2 means Grammar of Graphics, a graphic concept which describes plots by using a “grammar.”
-
Course by
-
Self Paced
-
3 ساعات
-
الإنجليزية

Building Data Visualization Tools
The data science revolution has produced reams of new data from a wide variety of new sources. These new datasets are being used to answer new questions in way never before conceived. Visualization remains one of the most powerful ways draw conclusions from data, but the influx of new data types requires the development of new visualization techniques and building blocks. This course provides you with the skills for creating those new visualization building blocks.
-
Course by
-
Self Paced
-
13 ساعات
-
الإنجليزية

Advanced Data Visualization with R
Data visualization is a critical skill for anyone that routinely using quantitative data in his or her work - which is to say that data visualization is a tool that almost every worker needs today. One of the critical tools for data visualization today is the R statistical programming language. Especially in conjunction with the tidyverse software packages, R has become an extremely powerful and flexible platform for making figures, tables, and reproducible reports.
-
Course by
-
Self Paced
-
11 ساعات
-
الإنجليزية
Customer Segmentation using K-Means Clustering in R
Welcome to this project-based course, Customer Segmentation using K-Means Clustering in R. In this project, you will learn how to perform customer market segmentation on mall customers data using different R packages.
-
Course by
-
Self Paced
-
3 ساعات
-
الإنجليزية
Data Visualization with R
In this course, you will learn the Grammar of Graphics, a system for describing and building graphs, and how the ggplot2 data visualization package for R applies this concept to basic bar charts, histograms, pie charts, scatter plots, line plots, and box plots. You will also learn how to further customize your charts and plots using themes and other techniques. You will then learn how to use another data visualization package for R called Leaflet to create map plots, a unique way to plot data based on geolocation data.
-
Course by
-
Self Paced
-
12 ساعات
-
الإنجليزية
Exploratory Data Analysis for the Public Sector with ggplot
Learn about the core pillars of the public sector and the core functions of public administration through statistical Exploratory Data Analysis (EDA). Learn analytical and technical skills using the R programming language to explore, visualize, and present data, with a focus on equity and the administrative functions of planning and reporting. Technical skills in this course will focus on the ggplot2 library of the tidyverse, and include developing bar, line, and scatter charts, generating trend lines, and understanding histograms, kernel density estimations, violin plots, and ridgeplots.
-
Course by
-
Self Paced
-
18 ساعات
-
الإنجليزية

Data Science with R - Capstone Project
In this capstone course, you will apply various data science skills and techniques that you have learned as part of the previous courses in the IBM Data Science with R Specialization or IBM Data Analytics with Excel and R Professional Certificate. For this project, you will assume the role of a Data Scientist who has recently joined an organization and be presented with a challenge that requires data collection, analysis, basic hypothesis testing, visualization, and modeling to be performed on real-world datasets.
-
Course by
-
Self Paced
-
26 ساعات
-
الإنجليزية

Mastering Software Development in R
R is a programming language and a free software environment for statistical computing and graphics, widely used by data analysts, data scientists and statisticians. This Specialization covers R software development for building data science tools.
-
Course by
-
Self Paced
-
الإنجليزية

Data Visualization using Plotnine and ggplot
Welcome to this 1.5 hour long guided project on Data Visualization using Plotnine and ggplot. Plotnine library is a powerful python visualization library based on R's ggplot2 package and a great package to make professional plots. It has the grammar of graphics from ggplot and is used to add layers that control geometries, facets, themes and many constructs. In this project you will learn how to create beautiful visualizations using plotnine and gglot constructs. This guided project is for anyone who wants to learn data visualization or already in the data science field.
-
Course by
-
Self Paced
-
3 ساعات
-
الإنجليزية
Expressway to Data Science: R Programming and Tidyverse
R is one of the most popular languages used in the data science community and essential for any aspiring data scientist. This specialization will teach you how to do data science in R whether you are a beginning or a seasoned programmer. You will begin this three-course specialization by reviewing the fundamentals of programming in R and the importance of creating reproducible research.
-
Course by
-
Self Paced
-
الإنجليزية