


Generative AI for Business Leaders
Advertising with Meta
How Google does Machine Learning


دوراتنا

IBM AI Enterprise Workflow
This six course specialization is designed to prepare you to take the certification examination for IBM AI Enterprise Workflow V1 Data Science Specialist. IBM AI Enterprise Workflow is a comprehensive, end-to-end process that enables data scientists to build AI solutions, starting with business priorities and working through to taking AI into production.
-
Course by

-
 الإنجليزية

IBM Data Analyst
Prepare for a career in the high-growth field of data analytics. In this program, you’ll learn in-demand skills like Python, Excel, and SQL to get job-ready in as little as 4 months. Data analysis is the process of collecting, storing, modeling, and analyzing data that can inform executive decision-making, and the demand for skilled data analysts has never been greater. This program will teach you the foundational data skills employers are seeking for entry-level data analytics roles.
-
Course by
-
 التعلم الذاتي
-
الإنجليزية

Select Topics in Python
This specialization is intended for people who are interested in furthering their Python skills. It is assumed that students are familiar with Python and have taken the Programming in Python: A Hands-On Tutorial. These four courses cover a wide range of topics. Learn how to create and manage Python package. Use Jupyter notebooks to visualize data with Matplotlib. The third course focuses on the basics of the Django web framework. Finally, learn how to leverage Python for natural langauge processing.
-
Course by
-
الإنجليزية

Evaluate Machine Learning Models with Yellowbrick
Welcome to this project-based course on Evaluating Machine Learning Models with Yellowbrick. In this course, we are going to use visualizations to steer our machine learning workflow. The problem we will tackle is to predict whether rooms in apartments are occupied or unoccupied based on passive sensor data such as temperature, humidity, light and CO2 levels. We will build a logistic regression model for binary classification. This is a continuation of the course on Room Occupancy Detection.
-
Course by
-
 3 ساعات
-
الإنجليزية

Visual Machine Learning with Yellowbrick
Welcome to this project-based course on Visual Machine Learning with Yellowbrick. In this course, we will explore how to evaluate the performance of a random forest classifier on the Poker Hand data set using visual diagnostic tools from Yellowbrick. With an emphasis on visual steering of our analysis, we will cover the following topics in our machine learning workflow: feature analysis, feature importance, algorithm selection, model evaluation using regression, cross-validation, and hyperparameter tuning.
-
Course by
-
3 ساعات
-
الإنجليزية

Google Advanced Data Analytics
Get professional training designed by Google and take the next step in your career with advanced data analytics skills. There are over 144,000 open jobs in advanced data analytics and the median salary for entry-level roles is $118,000.¹ Advanced data professionals are responsible for collecting, analyzing, and interpreting extremely large amounts of data.
-
Course by
-
Self Paced
-
الإنجليزية

IBM Data Science
Prepare for a career in the high-growth field of data science. In this program, you’ll develop the skills, tools, and portfolio to have a competitive edge in the job market as an entry-level data scientist in as little as 4 months. No prior knowledge of computer science or programming languages is required. Data science involves gathering, cleaning, organizing, and analyzing data with the goal of extracting helpful insights and predicting expected outcomes.
-
Course by
-
Self Paced
-
الإنجليزية

Unsupervised Text Classification for Marketing Analytics
Marketing data is often so big that humans cannot read or analyze a representative sample of it to understand what insights might lie within. In this course, learners use unsupervised deep learning to train algorithms to extract topics and insights from text data. Learners walk through a conceptual overview of unsupervised machine learning and dive into real-world datasets through instructor-led tutorials in Python. The course concludes with a major project. This course uses Jupyter Notebooks and the coding environment Google Colab, a browser-based Jupyter notebook environment.
-
Course by
-
Self Paced
-
13 ساعات
-
الإنجليزية

Create Machine Learning Models in Microsoft Azure
Machine learning is the foundation for predictive modeling and artificial intelligence. If you want to learn about both the underlying concepts and how to get into building models with the most common machine learning tools this path is for you. In this course, you will learn the core principles of machine learning and how to use common tools and frameworks to train, evaluate, and use machine learning models. This course is designed to prepare you for roles that include planning and creating a suitable working environment for data science workloads on Azure.
-
Course by
-
Self Paced
-
13 ساعات
-
الإنجليزية

Introduction to Computational Statistics for Data Scientists
The purpose of this series of courses is to teach the basics of Computational Statistics for the purpose of performing inference to aspiring or new Data Scientists. This is not intended to be a comprehensive course that teaches the basics of statistics and probability nor does it cover Frequentist statistical techniques based on the Null Hypothesis Significance Testing (NHST).
-
Course by
-
Self Paced
-
الإنجليزية

SQL for Data Science with R
Much of the world's data resides in databases. SQL (or Structured Query Language) is a powerful language which is used for communicating with and extracting data from databases. A working knowledge of databases and SQL is a must if you want to become a data scientist. The purpose of this course is to introduce relational database concepts and help you learn and apply foundational knowledge of the SQL and R languages. It is also intended to get you started with performing SQL access in a data science environment. The emphasis in this course is on hands-on and practical learning.
-
Course by
-
Self Paced
-
28 ساعات
-
الإنجليزية

Build Multilayer Perceptron Models with Keras
In this 45-minute long project-based course, you will build and train a multilayer perceptronl (MLP) model using Keras, with Tensorflow as its backend. We will be working with the Reuters dataset, a set of short newswires and their topics, published by Reuters in 1986. It's a very simple, widely used toy dataset for text classification. There are 46 different topics, some of which are more represented than others. But each topic has at least 10 examples in the training set.
-
Course by
-
3 ساعات
-
الإنجليزية

Deploy Models with TensorFlow Serving and Flask
In this 2-hour long project-based course, you will learn how to deploy TensorFlow models using TensorFlow Serving and Docker, and you will create a simple web application with Flask which will serve as an interface to get predictions from the served TensorFlow model.
-
Course by
-
Self Paced
-
3 ساعات
-
الإنجليزية

Introduction to Data Science
Interested in learning more about data science, but don’t know where to start? This 4-course Specialization from IBM will provide you with the key foundational skills any data scientist needs to prepare you for a career in data science or further advanced learning in the field. This Specialization will introduce you to what data science is and what data scientists do. You’ll discover the applicability of data science across fields, and learn how data analysis can help you make data driven decisions.
-
Course by
-
الإنجليزية

IBM Data Analytics with Excel and R
Prepare for the in-demand field of data analytics. In this program, you’ll learn high valued skills like Excel, Cognos Analytics, and R programming language to get job-ready in less than 3 months. Data analytics is a strategy-based science where data is analyzed to find trends, answer questions, shape business processes, and aid decision-making. This Professional Certificate focuses on data analysis using Microsoft Excel and R programming language.
-
Course by
-
Self Paced
-
الإنجليزية

Digital Signal Processing
This Specialization provides a full course in Digital Signal Processing, with a focus on audio processing and data transmission. You will start from the basic concepts of discrete-time signals and proceed to learn how to analyze data via the Fourier transform, how to manipulate data via digital filters and how to convert analog signals into digital format. Finally, you will also discover how to implement real-time DSP algorithms on a general-purpose microcontroller.
-
Course by
-
Self Paced
-
الإنجليزية
Interactive Geospatial Visualization:Kepler GL & Jupyter Lab
In this 1-hour long project-based course, you will learn how to easily create beautiful data visualization with Kepler inside Jupyter Notebooks and effectively design different geospatial data visualizations.
-
Course by
-
Self Paced
-
4 ساعات
-
الإنجليزية

Create Custom Layers in Keras
In this 1-hour long project-based course, you will learn how to create a custom layer in Keras, and create a model using the custom layer. In this project, we will create a simplified version of a Parametric ReLU layer, and use it in a neural network model. Then we will use the neural network to solve a multi-class classification problem. We will also compare our activation layer with the more commonly used ReLU activation layer.
-
Course by
-
2 ساعات
-
الإنجليزية

Statistics for Data Science with Python
This Statistics for Data Science course is designed to introduce you to the basic principles of statistical methods and procedures used for data analysis. After completing this course you will have practical knowledge of crucial topics in statistics including - data gathering, summarizing data using descriptive statistics, displaying and visualizing data, examining relationships between variables, probability distributions, expected values, hypothesis testing, introduction to ANOVA (analysis of variance), regression and correlation analysis.
-
Course by
-
Self Paced
-
14 ساعات
-
الإنجليزية

Data Science and Analysis Tools - from Jupyter to R Markdown
This specialization is intended for people without programming experience who seek an approachable introduction to data science that uses Python and R to describe and visualize data sets. This course will equip learners with foundational knowledge of data analysis suitable for any analyst roles. In these four courses, you will cover everything from data wrangling to data visualization.
-
Course by
-
Self Paced
-
الإنجليزية

Hierarchical Clustering using Euclidean Distance
By the end of this project, you will create a Python program using a jupyter interface that analyzes a group of viruses and plot a dendrogram based on similarities among them.
-
Course by
-
Self Paced
-
3 ساعات
-
الإنجليزية

Python Project for Data Science
This mini-course is intended to for you to demonstrate foundational Python skills for working with data. This course primarily involves completing a project in which you will assume the role of a Data Scientist or a Data Analyst and be provided with a real-world data set and a real-world inspired scenario to identify patterns and trends. You will perform specific data science and data analytics tasks such as extracting data, web scraping, visualizing data and creating a dashboard.
-
Course by
-
Self Paced
-
9 ساعات
-
الإنجليزية

Predict Sales Revenue with scikit-learn
In this 2-hour long project-based course, you will build and evaluate a simple linear regression model using Python. You will employ the scikit-learn module for calculating the linear regression, while using pandas for data management, and seaborn for plotting. You will be working with the very popular Advertising data set to predict sales revenue based on advertising spending through mediums such as TV, radio, and newspaper.
By the end of this course, you will be able to:
- Explain the core ideas of linear regression to technical and non-technical audiences
-
Course by
-
Self Paced
-
3 ساعات
-
الإنجليزية
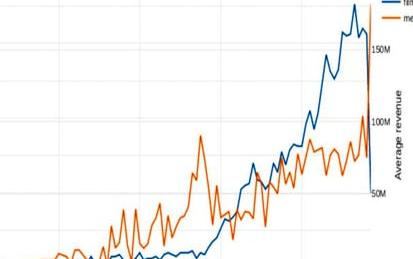
Analyze Box Office Data with Plotly and Python
Welcome to this project-based course on Analyzing Box Office Data with Plotly and Python. In this course, you will be working with the The Movie Database (TMDB) Box Office Prediction data set. The motion picture industry is raking in more revenue than ever with its expansive growth the world over. Can we build models to accurately predict movie revenue? Could the results from these models be used to further increase revenue? We try to answer these questions by way of exploratory data analysis (EDA) and feature engineering. We will primarily use Plotly for data visualization.
-
Course by
-
Self Paced
-
3 ساعات
-
الإنجليزية