


Generative AI for Business Leaders
Advertising with Meta
How Google does Machine Learning


دوراتنا
Getting Started with Power BI Desktop
In this 2-hour long project-based course, you will learn the basics of using Power BI Desktop software. We will do this by analyzing data on credit card defaults with Power BI Desktop. Power BI Desktop is a free Business Intelligence application from Microsoft that lets you load, transform, and visualize data. You can create interactive reports and dashboards quite easily, and quickly. We will learn some of the basics of Power BI by importing, transforming, and visualizing the data.
-
Course by

-
 Self Paced
-
 2 ساعات
-
 الإنجليزية

Microsoft PL-300 Exam Preparation and Practice
This course forms part of the Microsoft Power BI Analyst Professional Certificate. This Professional Certificate consists of a series of courses that offer a good starting point for a career in data analysis using Microsoft Power BI. This course will help you prepare for the Microsoft PL-300 exam. In this course, you’ll refresh your knowledge of all the key areas assessed in the Microsoft-certified Exam PL-300: Microsoft Power BI Data Analyst. In addition, you will prepare for the certification exam by taking a mock exam with a similar format and content as in the Microsoft PL-300 exam.
-
Course by
-
Self Paced
-
1 ساعات
-
الإنجليزية

From Excel to Power BI
Are you using Excel to manage, analyze, and visualize your data? Would you like to do more? Perhaps you've considered Power BI as an alternative, but have been intimidated by the idea of working in an advanced environment. The fact is, many of the same tools and mechanisms exist across both these Microsoft products. This means Excel users are actually uniquely positioned to transition to data modeling and visualization in Power BI! Using methods that will feel familiar, you can learn to use Power BI to make data-driven business decisions using large volumes of data.
-
Course by
-
Self Paced
-
3 ساعات
-
الإنجليزية

HR Analytics- Build an HR dashboard using Power BI
In this 1 hour long project, you will build an attractive and eye-catching HR dashboard using Power BI. We will begin this guided project by importing data & creating an employee demographics page that gives us the overall demographic outlook of the organization. We will then create pie charts and doughnut charts to visualize gender & racial diversity. In the final tasks, we will create an employee detail page that will provide you with all the important information about any employee with just a click.
-
Course by
-
Self Paced
-
2 ساعات
-
الإنجليزية

Microsoft Power BI Service - Publishing Reports to the Cloud
✓ Master Power BI Service (Cloud) ✓ Publish Power BI reports to the cloud ✓ Collaborate with colleagues in Power BI Service ✓ Create workspaces, manage permission, and share reports Looking to take your Power BI skills to the next level by publishing reports to the cloud? Look no further than this course on Power BI Service. In this course, you will learn step-by-step how to publish your reports to the cloud and share them with others. You will gain an understanding of how to create a workspace, manage permissions, and share reports with others.
-
Course by
-
Self Paced
-
3 ساعات
-
الإنجليزية
Using DAX throughout PowerBI to create robust data scenarios
If you don't use Data Analysis Expressions (DAX) Language, you will miss out on 95% of Power BI's potential as a fantastic analytical tool, and the journey to becoming a DAX master starts with the right step. This project-based course, "Using DAX throughout Power BI to create robust data scenarios," is intended for novice data analysts willing to advance their knowledge and skills.
-
Course by
-
Self Paced
-
3 ساعات
-
الإنجليزية
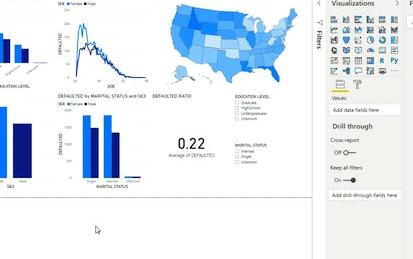
Data Visualization with Power BI: Storytelling with Data
Data is the new lifeblood of business and visualization has emerged as the common language. Effective communication with data is now a must-have skill for all employees at all levels. In this project, you will build a report to tell data stories to communicate business insights. We will start this hands-on project by preparing the dataset including creating calculated columns to enhance data storytelling. Then, we will create data stories for total sales for different data attributes.
-
Course by
-
Self Paced
-
2 ساعات
-
الإنجليزية
Get, Shape, Combine and Merge the datasets using Power BI
By the end of this project, you will be able to professionally format and manipulate different datasets using Power Bi. you will be able to identify the basics of power BI, use it to create a model, and import data from different types of data sources. Moreover, you will be able to manipulate your data, reduce the number of data, merge columns, replace values, change data types and apply statistical and standard functions. You will also be able to insert a new index column, append two or more queries with each other, and sort and clean your dataset.
-
Course by
-
Self Paced
-
3 ساعات
-
الإنجليزية

Preparing Data for Analysis with Microsoft Excel
This course forms part of the Microsoft Power BI Analyst Professional Certificate. This Professional Certificate consists of a series of courses that offers a good starting point for a career in data analysis using Microsoft Power BI. No prior skills are needed to be successful in this course. In this course, you’ll learn how to make use of Excel in business scenarios for data analysis.
-
Course by
-
Self Paced
-
19 ساعات
-
الإنجليزية
Create a Sales Dashboard using Power BI
In this 1 hour long project, you will build an attractive and eye-catching sales dashboard using Power BI in a black and blue theme that will make your audience go "wow". We will begin this guided project by importing data. We will then create bar charts and pie charts to visualize the sales data and then position the graphs on the dashboard. In the final tasks, we will create interactive maps to visualize sales data by countries and markets. By the end of this course, you will be confident in creating beautiful dashboards with many different kinds of visualizations.
-
Course by
-
Self Paced
-
2 ساعات
-
الإنجليزية

Analyzing and Visualizing Data with Power BI
Step up your analytics game and learn one of the most in-demand job skills in the United States. Content rebooted in September 2023!
-
Course by

-
Self Paced
-
6
-
الإنجليزية

Excel Power Tools for Data Analysis
Welcome to Excel Power Tools for Data Analysis. In this four-week course, we introduce Power Query, Power Pivot and Power BI, three power tools for transforming, analysing and presenting data. Excel's ease and flexibility have long made it a tool of choice for doing data analysis, but it does have some inherent limitations: for one, truly "big" data simply does not fit in a spreadsheet and for another, the process of importing and cleaning data can be a repetitive, time-consuming and error-prone.
-
Course by
-
15 ساعات
-
الإنجليزية