


Generative AI for Business Leaders
Advertising with Meta
How Google does Machine Learning


دوراتنا
Introduction to Business Analytics with R
Nearly every aspect of business is affected by data analytics. For businesses to capitalize on data analytics, they need leaders who understand the business analytic workflow. This course addresses the human skills gap by providing a foundational set of data processing skills that can be applied to many business settings. In this course you will use a data analytic language, R, to efficiently prepare business data for analytic tools such as algorithms and visualizations.
-
Course by

-
 Self Paced
-
 17 ساعات
-
 الإنجليزية

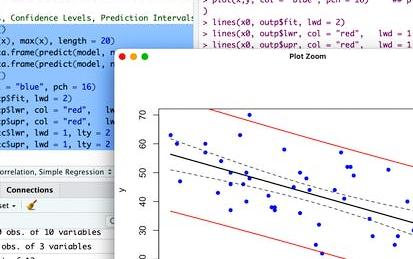
Linear Regression and Modeling
This course introduces simple and multiple linear regression models. These models allow you to assess the relationship between variables in a data set and a continuous response variable. Is there a relationship between the physical attractiveness of a professor and their student evaluation scores? Can we predict the test score for a child based on certain characteristics of his or her mother?
-
Course by
-
Self Paced
-
10 ساعات
-
الإنجليزية
Introduction to Probability and Data with R
This course introduces you to sampling and exploring data, as well as basic probability theory and Bayes' rule. You will examine various types of sampling methods, and discuss how such methods can impact the scope of inference. A variety of exploratory data analysis techniques will be covered, including numeric summary statistics and basic data visualization. You will be guided through installing and using R and RStudio (free statistical software), and will use this software for lab exercises and a final project.
-
Course by
-
Self Paced
-
14 ساعات
-
الإنجليزية

The Data Scientist's Toolbox
In this course you will get an introduction to the main tools and ideas in the data scientist's toolbox. The course gives an overview of the data, questions, and tools that data analysts and data scientists work with. There are two components to this course. The first is a conceptual introduction to the ideas behind turning data into actionable knowledge. The second is a practical introduction to the tools that will be used in the program like version control, markdown, git, GitHub, R, and RStudio.
-
Course by
-
Self Paced
-
18 ساعات
-
الإنجليزية

Data Analysis with R Programming
This course is the seventh course in the Google Data Analytics Certificate. In this course, you’ll learn about the programming language known as R. You’ll find out how to use RStudio, the environment that allows you to work with R, and the software applications and tools that are unique to R, such as R packages. You’ll discover how R lets you clean, organize, analyze, visualize, and report data in new and more powerful ways.
-
Course by
-
Self Paced
-
37 ساعات
-
الإنجليزية
Tout Pour Démarrer avec RStudio
Dans ce cours d'une heure, basé sur un projet, vous apprendrez comment démarrer avec RStudio IDE, sur votre ordinateur ou sur la solution en ligne de RStudio, comment créer des projets, installer des librairies R, ainsi qu'apprendre comment afficher des cartes interactives, des graphiques et des tableaux avec 1 ligne de code.
-
Course by
-
Self Paced
-
3 ساعات
-
الفرنسية

Financial Risk Management with R
This course teaches you how to calculate the return of a portfolio of securities as well as quantify the market risk of that portfolio, an important skill for financial market analysts in banks, hedge funds, insurance companies, and other financial services and investment firms. Using the R programming language with Microsoft Open R and RStudio, you will use the two main tools for calculating the market risk of stock portfolios: Value-at-Risk (VaR) and Expected Shortfall (ES). You will need a beginner-level understanding of R programming to complete the assignments of this course.
-
Course by
-
Self Paced
-
15 ساعات
-
الإنجليزية
RStudio for Six Sigma - Hypothesis Testing
Welcome to RStudio for Six Sigma - Hypothesis Testing. This is a project-based course which should take approximately 2 hours to finish.
-
Course by
-
Self Paced
-
3 ساعات
-
الإنجليزية

Reproducible Templates for Analysis and Dissemination
This course will assist you with recreating work that a previous coworker completed, revisiting a project you abandoned some time ago, or simply reproducing a document with a consistent format and workflow. Incomplete information about how the work was done, where the files are, and which is the most recent version can give rise to many complications. This course focuses on the proper documentation creation process, allowing you and your colleagues to easily reproduce the components of your workflow.
-
Course by
-
Self Paced
-
20 ساعات
-
الإنجليزية

Fundamentals of Data Analytics in the Public Sector with R
Gain a foundational understanding of key terms and concepts in public administration and public policy while learning foundational programming techniques using the R programming language. You will learn how to execute functions to load, select, filter, mutate, and summarize data frames using the tidyverse libraries with an emphasis on the dplyr package.
-
Course by
-
Self Paced
-
15 ساعات
-
الإنجليزية
Introduction to Distributions in R
This project is aimed at beginners who have a basic familiarity with the statistical programming language R and the RStudio environment, or people with a small amount of experience who would like to review the fundamentals of generating random numerical data from distributions in R.
-
Course by
-
Self Paced
-
2 ساعات
-
الإنجليزية
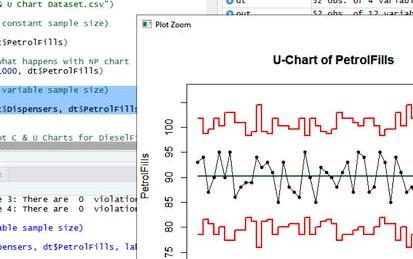
RStudio for Six Sigma - Control Charts
Welcome to RStudio for Six Sigma - Control Charts. This is a project-based course which should take under 2 hours to finish. Before diving into the project, please take a look at the course objectives and structure. By the end of this project, you will learn to identify data types (Variables, Attribute Type I & II), understand the overview of Statistical Process Control, pick the right Control Chart based on the data type and other criteria, plot and interpret control charts.
-
Course by
-
Self Paced
-
2 ساعات
-
الإنجليزية

Demand Planning in RStudio: Create Demand Forecast
This Guided Project Demand Planning in RStudio: Create Demand Forecast is for Supply Chain and/or Operations Analysts.
-
Course by
-
Self Paced
-
4 ساعات
-
الإنجليزية

Machine Learning Algorithms with R in Business Analytics
One of the most exciting aspects of business analytics is finding patterns in the data using machine learning algorithms. In this course you will gain a conceptual foundation for why machine learning algorithms are so important and how the resulting models from those algorithms are used to find actionable insight related to business problems. Some algorithms are used for predicting numeric outcomes, while others are used for predicting the classification of an outcome. Other algorithms are used for creating meaningful groups from a rich set of data.
-
Course by
-
Self Paced
-
14 ساعات
-
الإنجليزية
Customer Segmentation using K-Means Clustering in R
Welcome to this project-based course, Customer Segmentation using K-Means Clustering in R. In this project, you will learn how to perform customer market segmentation on mall customers data using different R packages.
-
Course by
-
Self Paced
-
3 ساعات
-
الإنجليزية

Introduction to R: Basic R syntax
This guided project is for beginners interested in taking their first steps with coding in the statistical language R. It assumes no previous knowledge of R, introduces the RStudio environment, and covers basic concepts, tools, and general syntax. By the end of the exercise, learners will build familiarity with RStudio and the fundamentals of the statistical coding language R.
-
Course by
-
Self Paced
-
4 ساعات
-
الإنجليزية
Exploratory Data Analysis for the Public Sector with ggplot
Learn about the core pillars of the public sector and the core functions of public administration through statistical Exploratory Data Analysis (EDA). Learn analytical and technical skills using the R programming language to explore, visualize, and present data, with a focus on equity and the administrative functions of planning and reporting. Technical skills in this course will focus on the ggplot2 library of the tidyverse, and include developing bar, line, and scatter charts, generating trend lines, and understanding histograms, kernel density estimations, violin plots, and ridgeplots.
-
Course by
-
Self Paced
-
18 ساعات
-
الإنجليزية
Line Balancing With MILP Optimization In RStudio
By the end of this project, you will learn to use R lpSolveAPI. You will learn to:
# Formulate Line Balancing Problem & Determine Objective Function
# Apply Constraints On Tasks Assignment To Stations
# Apply The Sum Of Durations Constraints On Tasks
# Apply Task Precedence Relationship Constraints
# Run Optimiser, Obtain & Analyse Solution
-
Course by
-
Self Paced
-
3 ساعات
-
الإنجليزية
Quantitative Text Analysis and Measures of Readability in R
By the end of this project, you will be able to load textual data into R and turn it into a corpus object. You will also understand the concept of measures of readability in textual analysis. You will know how to estimate the level of readability of a text document or corpus of documents using a number of different readability metrics and how to plot the variation in readability levels in a text document corpus over time at the document and paragraph level.
-
Course by
-
Self Paced
-
3 ساعات
-
الإنجليزية

Data Science Methods for Quality Improvement
Data analysis skills are widely sought by employers, both nationally and internationally. This specialization is ideal for anyone interested in data analysis for improving quality and processes in business and industry. The skills taught in this specialization have been used extensively to improve business performance, quality, and reliability. By completing this specialization, you will improve your ability to analyze data and interpret results as well as gain new skills, such as using RStudio and RMarkdown.
-
Course by
-
Self Paced
-
الإنجليزية

IBM Data Science
Prepare for a career in the high-growth field of data science. In this program, you’ll develop the skills, tools, and portfolio to have a competitive edge in the job market as an entry-level data scientist in as little as 4 months. No prior knowledge of computer science or programming languages is required. Data science involves gathering, cleaning, organizing, and analyzing data with the goal of extracting helpful insights and predicting expected outcomes.
-
Course by
-
Self Paced
-
الإنجليزية
Business Analytics
Our world has become increasingly digital, and business leaders need to make sense of the enormous amount of available data today. In order to make key strategic business decisions and leverage data as a competitive advantage, it is critical to understand how to draw key insights from this data.
-
Course by
-
الإنجليزية

Data Analytics in the Public Sector with R
Every government entity collects and stores millions of data points to perform administrative and legislative duties, allocate resources, and make decisions. Professionals in the public sector need the necessary skills to accurately interpret and inform administrators and policymakers about the meaning behind these data. This Specialization will equip you with fundamental technical skills using the R programming language to gather, manipulate, analyze, visualize, and interpret data to inform public policy and public administrative functions.
-
Course by
-
Self Paced
-
الإنجليزية

Get Started with R Markdown
Welcome to this project-based course, Get Started with R Markdown. This project-based course is for people who are learning R and seek useful ways to organize their work in R. We will start this hands-on project with an overview of the project; then, we will get familiar with the RStudio interface and install the rmarkdown package. Be rest assured that you will learn a ton of good work here.
-
Course by
-
Self Paced
-
3 ساعات
-
الإنجليزية
Introduction to Data Science
Interested in learning more about data science, but don’t know where to start? This 4-course Specialization from IBM will provide you with the key foundational skills any data scientist needs to prepare you for a career in data science or further advanced learning in the field. This Specialization will introduce you to what data science is and what data scientists do. You’ll discover the applicability of data science across fields, and learn how data analysis can help you make data driven decisions.
-
Course by
-
الإنجليزية