

دوراتنا

Virtual Building Design for Engineers Using Autodesk Revit
This course is a beginners guide to Autodesk Revit software. Students will learn the fundamentals of Autodesk Revit’s functionality and how Design Professionals and Project Teams use Autodesk Revit-centric and BIM-centric workflows for design and construction optimization, coordination, visualization, and automation.
-
Course by

-
 10
10
-
 الإنجليزية

Advanced Data Science with IBM
As a coursera certified specialization completer you will have a proven deep understanding on massive parallel data processing, data exploration and visualization, and advanced machine learning & deep learning. You'll un…
-
Course by

-
 Self Paced
-
 الإنجليزية

Data Literacy
This specialization is intended for professionals seeking to develop a skill set for interpreting statistical results. Through four courses and a capstone project, you will cover descriptive statistics, data visualization, measurement, regression modeling, probability and uncertainty which will prepare you to interpret and critically evaluate a quantitative analysis.
-
Course by

-
 Self Paced
-
 الإنجليزية

Business Intelligence con la Product Suite di Tableau
Questo corso è rivolto a tutti coloro che hanno maturato una conoscenza solida di Tableau. Dopo aver imparato a analizzare dati e costruire visualizzazioni è arrivato il momento di approfondire la conoscenza della Business Intelligence (BI) e andare oltre Tableau. La week 1 è dedicata alle Dashboard e alle Story.
-
Course by

-
 Self Paced
-
 25 ساعات
-
 الإيطالية

Data Science: Foundations using R
Ask the right questions, manipulate data sets, and create visualizations to communicate results. This Specialization covers foundational data science tools and techniques, including getting, cleaning, and exploring data, programming in R, and conducting reproducible research. Learners who complete this specialization will be prepared to take the Data Science: Statistics and Machine Learning specialization, in which they build a data product using real-world data. The five courses in this specialization are the very same courses that make up the first half of the Data Science Specialization.
-
Course by

-
 Self Paced
-
 الإنجليزية

Data Visualization with Tableau
In 2020 the world will generate 50 times the amount of data as in 2011. And 75 times the number of information sources (IDC, 2011). Being able to use this data provides huge opportunities and to turn these opportunities into reality, people need to use data to solve problems. This Specialization, in collaboration with Tableau, is intended for newcomers to data visualization with no prior experience using Tableau. We leverage Tableau's library of resources to demonstrate best practices for data visualization and data storytelling.
-
Course by

-
 Self Paced
-
 الإنجليزية
Information Visualization: Applied Perception
This module aims at introducing fundamental concepts of visual perception applied to information visualization. These concepts help the student ideate and evaluate visualization designs in terms of how well they leverage the capabilities of the human perceptual machinery.
-
Course by

-
 Self Paced
-
 12 ساعات
-
 الإنجليزية

Responsive Website Development and Design
Responsive web design is all about creating the best user experience regardless of whether a user is accessing your site from a desktop computer, a mobile phone, or a tablet. This Specialisation covers the basics of modern full stack web development, from UX design to front-end coding to custom databases. You’ll build foundational skills in a full range of technologies, including HTML/CSS, Javascript, and MongoDB, and you’ll learn to implement a reactive, multi-user web application using the meteor.js framework.
-
Course by

-
 Self Paced
-
 الإنجليزية
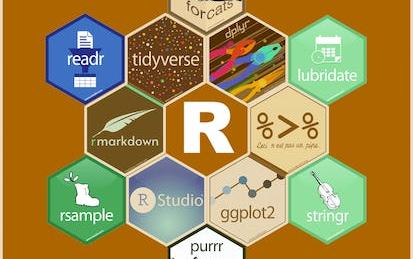
Expressway to Data Science: R Programming and Tidyverse
R is one of the most popular languages used in the data science community and essential for any aspiring data scientist. This specialization will teach you how to do data science in R whether you are a beginning or a seasoned programmer. You will begin this three-course specialization by reviewing the fundamentals of programming in R and the importance of creating reproducible research.
-
Course by

-
 Self Paced
-
 الإنجليزية

Data Analytics and Visualization in Health Care
Learn best practices in data analytics, informatics, and visualization to gain literacy in data-driven, strategic imperatives that affect all facets of health care.
-
Course by

-
 الإنجليزية

Data Representation and Visualization in Tableau
Use Tableau to explore data and discover insights to innovate data-driven decision-making.
-
Course by

-
 الإنجليزية

Strategic Communication for Sustainability Leaders
Communicating science effectively is a critical skill for anyone involved in environmental policy or sustainability. Learn how to integrate effective visualizations into compelling narratives to clearly explain complex ecosystem processes.
-
Course by

-
 32
32
-
 الإنجليزية

Stakeholder Outreach: Effective Communication of Complex Environmental Threats
Learn how to engage communities through powerful storytelling, data visualization, and persuasive presence to motivate action on complex environmental projects.
-
Course by

-
 10
10
-
 الإنجليزية

Data Structures & Algorithms I: ArrayLists, LinkedLists, Stacks and Queues
Work with the principles of data storage in Arrays, ArrayLists & LinkedList nodes. Understand their operations and performance with visualizations. Implement low-level linear, linked data structures with recursive methods, and explore their edge cases. Extend these structures to the Abstract Data Types, Stacks, Queues and Deques.
-
Course by

-
 الإنجليزية

Storytelling and Persuading using Data and Digital Technologies
Learn how to gain traction for your digital transformation initiatives with stories based on data that use compelling data visualizations to build a persuasive business case.
-
Course by

-
 10
10
-
 الإنجليزية

MATLAB Essentials
Master the essentials of data visualization, data analysis, programming, and app design interactively with MATLAB.
-
Course by

-
 Self Paced
-
 6
6
-
 الإنجليزية

R Data Science Capstone Project
Apply various data analysis and visualization skills and techniques you have learned by taking on the role of a data scientist working with real-world data sets.
-
Course by

-
 21
21
-
 الإنجليزية

Data Visualization and Building Dashboards with Excel and Cognos
Build the fundamental knowledge necessary to use Excel and IBM Cognos Analytics to create data visualizations and to create dashboards containing those visualizations to help tell a lucid story about data.
-
Course by

-
 Self Paced
-
 28
28
-
 الإنجليزية
Visualizing Data with Python
Data visualization is the graphical representation of data in order to interactively and efficiently convey insights to clients, customers, and stakeholders in general.
-
Course by

-
 Self Paced
-
 28
28
-
 الإنجليزية

Data Analytics and Visualization Capstone Project
Accelerate the knowledge you gain from previous courses in the IBM Data Analyst Professional Certificate program. Assume the role of an Associate Data Analyst and use various skills and techniques on real-world datasets to accomplish a task.
-
Course by

-
 15
15
-
 الإنجليزية

MATLAB and Octave for Beginners
Learn MATLAB and Octave and start experimenting with matrix manipulations, data visualizations, functions and mathematical computations.
-
Course by

-
 44
44
-
 الإنجليزية

Excel for Everyone: Data Analysis Fundamentals
Perform advanced data wrangling, analysis and dashboard visualization to help drive strategic decision-making.
-
Course by

-
 Self Paced
-
 الإنجليزية
Advanced Bioconductor
Learn advanced approaches to genomic visualization, reproducible analysis, data architecture, and exploration of cloud-scale consortium-generated genomic data.
-
Course by

-
 44
44
-
 الإنجليزية

Data Science: Visualization
Learn basic data visualization principles and how to apply them using ggplot2.
-
Course by

-
 Self Paced
-
 12
12
-
 الإنجليزية

Introduction to Digital Humanities
Develop skills in digital research and visualization techniques across subjects and fields within the humanities.
-
Course by

-
 35
35
-
 الإنجليزية


