


Generative AI for Business Leaders
Advertising with Meta
How Google does Machine Learning


دوراتنا

Data Analytics and Visualization Capstone Project
Accelerate the knowledge you gain from previous courses in the IBM Data Analyst Professional Certificate program. Assume the role of an Associate Data Analyst and use various skills and techniques on real-world datasets to accomplish a task.
-
Course by

-
 15
15
-
 الإنجليزية

MATLAB and Octave for Beginners
Learn MATLAB and Octave and start experimenting with matrix manipulations, data visualizations, functions and mathematical computations.
-
Course by
-
44
-
الإنجليزية

Excel for Everyone: Data Analysis Fundamentals
Perform advanced data wrangling, analysis and dashboard visualization to help drive strategic decision-making.
-
Course by
-
 Self Paced
-
الإنجليزية

Advanced Bioconductor
Learn advanced approaches to genomic visualization, reproducible analysis, data architecture, and exploration of cloud-scale consortium-generated genomic data.
-
Course by
-
44
-
الإنجليزية

Data Science: Visualization
Learn basic data visualization principles and how to apply them using ggplot2.
-
Course by
-
Self Paced
-
12
-
الإنجليزية

Introduction to Digital Humanities
Develop skills in digital research and visualization techniques across subjects and fields within the humanities.
-
Course by
-
35
-
الإنجليزية

Data Structures & Algorithms III: AVL and 2-4 Trees, Divide and Conquer Algorithms
Learn more complex tree data structures, AVL and (2-4) trees. Investigate the balancing techniques found in both tree types. Implement these techniques in AVL operations. Explore sorting algorithms with simple iterative sorts, followed by Divide and Conquer algorithms. Use the course visualizations to understand the performance.
-
Course by
-
Self Paced
-
الإنجليزية

Mastering Software Development in R
R is a programming language and a free software environment for statistical computing and graphics, widely used by data analysts, data scientists and statisticians. This Specialization covers R software development for building data science tools.
-
Course by

-
Self Paced
-
الإنجليزية

IBM Data Science
Prepare for a career in the high-growth field of data science. In this program, you’ll develop the skills, tools, and portfolio to have a competitive edge in the job market as an entry-level data scientist in as little as 4 months. No prior knowledge of computer science or programming languages is required. Data science involves gathering, cleaning, organizing, and analyzing data with the goal of extracting helpful insights and predicting expected outcomes.
-
Course by
-
Self Paced
-
الإنجليزية

Applied Data Science with R
This Specialization is intended for anyone with a passion for learning who is seeking to develop the job-ready skills, tools, and portfolio to have a competitive edge in the job market as an entry-level data scientist. Through these five online courses, you will develop the skills you need to bring together often disparate and disconnected data sources and use the R programming language to transform data into insights that help you and your stakeholders make more informed decisions. By the end of this Specialization, you will be able to perform basic R programming tasks to complete the data
-
Course by
-
Self Paced
-
الإنجليزية

Evaluate Machine Learning Models with Yellowbrick
Welcome to this project-based course on Evaluating Machine Learning Models with Yellowbrick. In this course, we are going to use visualizations to steer our machine learning workflow. The problem we will tackle is to predict whether rooms in apartments are occupied or unoccupied based on passive sensor data such as temperature, humidity, light and CO2 levels. We will build a logistic regression model for binary classification. This is a continuation of the course on Room Occupancy Detection.
-
Course by
-
3 ساعات
-
الإنجليزية
From Data to Insights with Google Cloud
Want to know how to query and process petabytes of data in seconds? Curious about data analysis that scales automatically as your data grows? Welcome to the Data Insights course! This four-course accelerated online specialization teaches course participants how to derive insights through data analysis and visualization using the Google Cloud Platform. The courses feature interactive scenarios and hands-on labs where participants explore, mine, load, visualize, and extract insights from diverse Google BigQuery datasets.
-
Course by
-
Self Paced
-
الإنجليزية

Social Determinants of Health: Health Care Systems
This third of five courses explores topics related to the social determinants of health and health care systems. This course will also focus on the relationship between the social determinants of health, mental health, substance abuse, and trauma. The topics of this course include: 1. Health Literacy 2. Mental Health & Substance Abuse 3. Violence, Conflict, and Trauma 4. Ethical Considerations for Health Systems and Data 5. Data Applications: Correlation Analysis and Heat Map Visualization
-
Course by
-
Self Paced
-
23 ساعات
-
الإنجليزية
Data Science
Ask the right questions, manipulate data sets, and create visualizations to communicate results. This Specialization covers the concepts and tools you'll need throughout the entire data science pipeline, from asking the right kinds of questions to making inferences and publishing results. In the final Capstone Project, you’ll apply the skills learned by building a data product using real-world data. At completion, students will have a portfolio demonstrating their mastery of the material.
-
Course by
-
Self Paced
-
الإنجليزية
Creating Business Value with Data and Looker
This series of courses introduces data in the cloud and Looker to someone who would like to become a Looker Developer. It includes the background on how data is managed in the cloud and how it can be used to create value for an organization. You will then learn the skills you need as a Looker Developer to use the Looker Modeling Language (LookML) to empower your organization to conduct self-serve data exploration, analysis and visualization.
-
Course by
-
Self Paced
-
الإنجليزية

Manage Idea Generation with Brainwriting in Miro
By the end of this project, you will be able to team idea generation with brainwriting techniques in Miro.
To do this, you will gain hands-on experience applying guided brainstorming strategies to create a brainwriting visualization through in the Miro online visual collaboration platform for teamwork.
Note: This course works best for learners who are based in the North America region. We’re currently working on providing the same experience in other regions.
-
Course by
-
Self Paced
-
2 ساعات
-
الإنجليزية

Data Analysis and Visualization with Power BI
This course forms part of the Microsoft Power BI Analyst Professional Certificate. This Professional Certificate consists of a series of courses that offers a good starting point for a career in data analysis using Microsoft Power BI. In this course, you will learn report design and formatting in Power BI, which offers extraordinary visuals for building reports and dashboards. Additionally, you will learn how to use report navigation to tell a compelling, data-driven story in Power BI.
-
Course by
-
Self Paced
-
30 ساعات
-
الإنجليزية

Data Structures & Algorithms I: ArrayLists, LinkedLists, Stacks and Queues
Work with the principles of data storage in Arrays, ArrayLists & LinkedList nodes. Understand their operations and performance with visualizations. Implement low-level linear, linked data structures with recursive methods, and explore their edge cases. Extend these structures to the Abstract Data Types, Stacks, Queues and Deques.
-
Course by
-
الإنجليزية

Analytics for Decision Making
The field of analytics is typically built on four pillars: Descriptive Analytics, Predictive Analytics, Causal Analytics, and Prescriptive Analytics. Descriptive analytics (e.g., visualization, BI) deal with the exploration of data for patterns, predictive analytics (e.g., data mining, time-series forecasting) identifies what can happen next, causal modeling establishes causation, and prescriptive analytics help with formulating decisions. This specialization focuses on the Prescriptive Analytics (the final pillar).
-
Course by
-
الإنجليزية

Business Intelligence con la Product Suite di Tableau
Questo corso è rivolto a tutti coloro che hanno maturato una conoscenza solida di Tableau. Dopo aver imparato a analizzare dati e costruire visualizzazioni è arrivato il momento di approfondire la conoscenza della Business Intelligence (BI) e andare oltre Tableau. La week 1 è dedicata alle Dashboard e alle Story.
-
Course by
-
Self Paced
-
25 ساعات
-
الإيطالية
AutoML tools for data science
By the end of this project, you will learn how to perform analysis on data using different python libraries and export reports and visualization without much hassle all this with minimal coding.
-
Course by
-
Self Paced
-
3 ساعات
-
الإنجليزية
Excel Skills for Data Analytics and Visualization
As data becomes the modern currency, so the ability to quickly and accurately analyse data has become of paramount importance. Therefore, data analytics and visualization are two of the most sought after skills for high paying jobs with strong future growth prospects. According to an IBM report, the Excel tools for data analytics and visualization are among the top 10 competencies projected to show double-digit growth in their demand.
-
Course by
-
Self Paced
-
الإنجليزية

Database Design and Operational Business Intelligence
The goal of this specialization is to provide a comprehensive and holistic view of business intelligence and its enabling technologies, including relational databases, data warehousing, descriptive statistics, data mining, and visual analytics. Through this series of courses, you will explore relational database design, data manipulation through Extract/Transform/Load (ETL), gaining actionable insight through data analytics, data-based decision support, data visualization, and practical, hands-on experience with real-world business intelligence tools.
-
Course by
-
Self Paced
-
الإنجليزية

Data Analytics in the Public Sector with R
Every government entity collects and stores millions of data points to perform administrative and legislative duties, allocate resources, and make decisions. Professionals in the public sector need the necessary skills to accurately interpret and inform administrators and policymakers about the meaning behind these data. This Specialization will equip you with fundamental technical skills using the R programming language to gather, manipulate, analyze, visualize, and interpret data to inform public policy and public administrative functions.
-
Course by
-
Self Paced
-
الإنجليزية
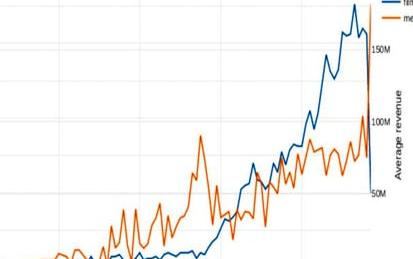
Analyze Box Office Data with Plotly and Python
Welcome to this project-based course on Analyzing Box Office Data with Plotly and Python. In this course, you will be working with the The Movie Database (TMDB) Box Office Prediction data set. The motion picture industry is raking in more revenue than ever with its expansive growth the world over. Can we build models to accurately predict movie revenue? Could the results from these models be used to further increase revenue? We try to answer these questions by way of exploratory data analysis (EDA) and feature engineering. We will primarily use Plotly for data visualization.
-
Course by
-
Self Paced
-
3 ساعات
-
الإنجليزية