


Generative AI for Business Leaders
Advertising with Meta
How Google does Machine Learning


دوراتنا

Applied Data Science Capstone
This is the final course in the IBM Data Science Professional Certificate as well as the Applied Data Science with Python Specialization. This capstone project course will give you the chance to practice the work that data scientists do in real life when working with datasets.
-
Course by

-
 Self Paced
-
 13 ساعات
-
 الإنجليزية

IBM Data Analyst Capstone Project
By completing this final capstone project you will apply various Data Analytics skills and techniques that you have learned as part of the previous courses in the IBM Data Analyst Professional Certificate. You will assume the role of an Associate Data Analyst who has recently joined the organization and be presented with a business challenge that requires data analysis to be performed on real-world datasets.
-
Course by
-
Self Paced
-
21 ساعات
-
الإنجليزية
NetLogo's BehaviorSpace + RAWGraphs
In this project-based course, you will be introduced to and explore one of the most relevant features of NetLogo: BehaviorSpace. The context behind such a feature is that a model's true insights arise when it runs multiple times with different combinations of settings (parameter values). This approach, sometimes referred to as parameter sweeping, allows the researcher to observe a large range of behaviors that the system is capable of producing. And that is exactly what you will be doing.
-
Course by
-
Self Paced
-
2 ساعات
-
الإنجليزية

Interactive Statistical Data Visualization 101
In this guided project, we will explore plotly express to visualize statistical plots such as box plots, histograms, heatmaps, density maps, contour plots, and violin plots. Plotly express is a super powerful Python package that empowers anyone to create, manipulate and render graphical figures. This crash course is super practical and directly applicable to many industries such as banking, finance and tech industries. Note: This course works best for learners who are based in the North America region. We’re currently working on providing the same experience in other regions.
-
Course by
-
Self Paced
-
3 ساعات
-
الإنجليزية

Data Visualization using Plotly
Welcome to this 1 hour long guided project on Data Visualization using Plotly. Plotly is a python graphing library which is used to make interactive, publication-quality graphs. It allows users to import, copy and paste, or stream data to be analyzed and visualized. In this project you will learn how to create beautiful visualizations using Plotly constructs. This guided project is for anyone who wants to learn data visualization or already in the data science field.
-
Course by
-
Self Paced
-
1 ساعات
-
الإنجليزية

Social Determinants of Health: Methodological Opportunities
This fourth of five courses examines the methodological approaches and research tools that inform our understanding of best practices in working with science teams, communities, and with data. The topics of this course include: 1. Community-Based Participatory Research 2. Team Science 3. Community-Level Data 4. Informatics and the Social Determinants of Health: Knowledge Management 5. Data Applications: ANOVA Analysis and Line Graph Visualization
-
Course by
-
Self Paced
-
18 ساعات
-
الإنجليزية

Data Visualization Best Practices
In this course, we will cover the basics of visualization and how it fits into the Data Science workflow. We will focus on the main concepts behind the purpose of visualization and the design principles for creating effective, easy-to-communicate results. You will also set up your Tableau environment, practice data loading, and perform univariate descriptive analysis of the S&P 500 stock sectors.
-
Course by
-
Self Paced
-
9 ساعات
-
الإنجليزية
Building Data Visualization Tools
The data science revolution has produced reams of new data from a wide variety of new sources. These new datasets are being used to answer new questions in way never before conceived. Visualization remains one of the most powerful ways draw conclusions from data, but the influx of new data types requires the development of new visualization techniques and building blocks. This course provides you with the skills for creating those new visualization building blocks.
-
Course by
-
Self Paced
-
13 ساعات
-
الإنجليزية
Python for Data Visualization: Matplotlib & Seaborn
In this hands-on project, we will understand the fundamentals of data visualization with Python and leverage the power of two important python libraries known as Matplotlib and seaborn. We will learn how to generate line plots, scatterplots, histograms, distribution plot, 3D plots, pie charts, pair plots, countplots and many more! Note: This course works best for learners who are based in the North America region. We’re currently working on providing the same experience in other regions.
-
Course by
-
Self Paced
-
4 ساعات
-
الإنجليزية
Select Topics in Python: Matplotlib
Code and run your first Python script with Matplotlib in minutes without installing anything! This course is designed for learners with some Python experience, and provides a crash course in Matplotlib. This enables the learners to delve into core data visualization topics that can be transferred to other languages.
-
Course by
-
Self Paced
-
7 ساعات
-
الإنجليزية
Data and Statistics Foundation for Investment Professionals
Aimed at investment professionals or those with investment industry knowledge, this course offers an introduction to the basic data and statistical techniques that underpin data analysis and lays an essential foundation in the techniques that are used in big data and machine learning. It introduces the topics and gives practical examples of how they are used by investment professionals, including the importance of presenting the “data story" by using appropriate visualizations and report writing.
In this course you will learn how to:
-
Course by
-
Self Paced
-
21 ساعات
-
الإنجليزية

Perform Feature Analysis with Yellowbrick
Welcome to this project-based course on Performing Feature Analysis with Yellowbrick. In this course, we are going to use visualizations to steer machine learning workflows. The problem we will tackle is to predict whether rooms in apartments are occupied or unoccupied based on passive sensor data such as temperature, humidity, light and CO2 levels.
-
Course by
-
Self Paced
-
3 ساعات
-
الإنجليزية

Get Started With Tableau
Tableau is a powerful software program frequently used by business analysts in a variety of departments including sales, marketing, finance, operation and more. Analysts within these departments use Tableau to create visualizations that explain datasets and tell data stories. In this project, learners will learn the basic steps to begin using Tableau. They will learn how to upload data and how the user interface works. Learners will move on to understand the difference between dimensions and measures as well as discrete and concrete variables.
-
Course by
-
Self Paced
-
3 ساعات
-
الإنجليزية
Data Modeling in Power BI
This course forms part of the Microsoft Power BI Analyst Professional Certificate. This Professional Certificate consists of a series of courses that offers a good starting point for a career in data analysis using Microsoft Power BI. In this course, you'll learn how to use Power BI to create and maintain relationships in a data model and form a model using multiple Schemas. You'll explore the basics of DAX, Power BI's expression language, and add calculations to your model to create elements and analysis in Power BI.
-
Course by
-
Self Paced
-
الإنجليزية

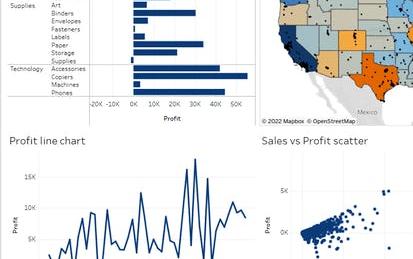
Create Digital Marketing Campaign Dashboards in Tableau
How we consume data is often just as important as the data itself. If data remains in columns and rows and is a matrix of numbers, it will continue to be mysterious, confusing, and misunderstood. One of the most powerful ways that data can be easily understood is by making a dashboard. Tableau dashboards are easy to create, interactive, and highly customizable. In this video, learners will learn how to create a digital marketing dashboard. Along the way, they will learn the Tableau techniques that are easily applicable to business spaces outside of digital marketing.
-
Course by
-
Self Paced
-
3 ساعات
-
الإنجليزية

Using Covid-19 Data to Make Supply Chain Logistics Decisions in Spreadsheets
The Supply Chain Planning course walks learners through the critical first step in Supply Chain Management, planning. In the course project scenario, your company supplies Personal Protective Equipment and ventilators to hospitals and clinics across the US. You have been asked by your company’s executives and state health officials to prepare an analysis of the US, by state and region, identifying locations of highest need for supplies and ventilators. This is called a Supply Plan. Throughout the course you will walk through building the Supply Plan.
-
Course by
-
Self Paced
-
1 ساعات
-
الإنجليزية

Time Series Data Visualization And Analysis Techniques
By the end of this project we will learn how to analyze time series data. We are going to talk about different visualization techniques for time series datasets and we are going to compare them in terms of the tasks that we can solve using each of them. Tasks such as outlier detection, Key moments detection and overall tren
-
Course by
-
Self Paced
-
3 ساعات
-
الإنجليزية
Communicating Data Science Results
Important note: The second assignment in this course covers the topic of Graph Analysis in the Cloud, in which you will use Elastic MapReduce and the Pig language to perform graph analysis over a moderately large dataset, about 600GB. In order to complete this assignment, you will need to make use of Amazon Web Services (AWS). Amazon has generously offered to provide up to $50 in free AWS credit to each learner in this course to allow you to complete the assignment.
-
Course by
-
Self Paced
-
8 ساعات
-
الإنجليزية

Support Vector Machine Classification in Python
In this 1-hour long guided project-based course, you will learn how to use Python to implement a Support Vector Machine algorithm for classification. This type of algorithm classifies output data and makes predictions. The output of this model is a set of visualized scattered plots separated with a straight line.
You will learn the fundamental theory and practical illustrations behind Support Vector Machines and learn to fit, examine, and utilize supervised Classification models using SVM to classify data, using Python.
-
Course by
-
Self Paced
-
3 ساعات
-
الإنجليزية
Preparing and Aggregating Data for Visualizations using Cloud Dataprep
This is a self-paced lab that takes place in the Google Cloud console. Dataprep by Trifacta is Google's self-service data preparation tool built in collaboration with Trifacta. In this lab you will learn some more advanced techniques with Dataprep.
-
Course by
-
Self Paced
-
1 ساعات
-
الإنجليزية
Importing Data in the Tidyverse
Getting data into your statistical analysis system can be one of the most challenging parts of any data science project. Data must be imported and harmonized into a coherent format before any insights can be obtained. You will learn how to get data into R from commonly used formats and harmonizing different kinds of datasets from different sources.
-
Course by
-
Self Paced
-
15 ساعات
-
الإنجليزية

Introduction to Neurohacking In R
Neurohacking describes how to use the R programming language (https://cran.r-project.org/) and its associated package to perform manipulation, processing, and analysis of neuroimaging data. We focus on publicly-available structural magnetic resonance imaging (MRI).
-
Course by
-
Self Paced
-
18 ساعات
-
الإنجليزية

Capstone: Retrieving, Processing, and Visualizing Data with Python
In the capstone, students will build a series of applications to retrieve, process and visualize data using Python. The projects will involve all the elements of the specialization. In the first part of the capstone, students will do some visualizations to become familiar with the technologies in use and then will pursue their own project to visualize some other data that they have or can find. Chapters 15 and 16 from the book “Python for Everybody” will serve as the backbone for the capstone. This course covers Python 3.
-
Course by
-
Self Paced
-
10 ساعات
-
الإنجليزية

Creating an Interactive Graph with Tableau Public
By the end of this guided project, learners will have created an interactive graph that applies principles of data visualization to tell a story using basic sales data. This project will illustrate some of the basic features of Tableau software and allow learners to obtain a good introduction to using the open source software, Tableau Public. In this project, learners will use sample data as a building block to create a shareable interactive data visualization chart.
-
Course by
-
Self Paced
-
2 ساعات
-
الإنجليزية
Data Visualization in Tableau: Create Dashboards and Stories
Use Tableau Web Authoring to create best practice dashboards and stories from data
-
Course by
-
Self Paced
-
2 ساعات
-
الإنجليزية