


Generative AI for Business Leaders
Advertising with Meta
How Google does Machine Learning


دوراتنا

Introduction to Data Analytics on Google Cloud
In this beginner-level course, you will learn about the Data Analytics workflow on Google Cloud and the tools you can use to explore, analyze, and visualize data and share your findings with stakeholders. Using a case study along with hands-on labs, lectures, and quizzes/demos, the course will demonstrate how to go from raw datasets to clean data to impactful visualizations and dashboards. Whether you already work with data and want to learn how to be successful on Google Cloud, or you’re looking to progress in your career, this course will help you get started.
-
Course by

-
 Self Paced
-
 4 ساعات
-
 الإنجليزية
Build and deploy a stroke prediction model using R
In this project, you’ll help a leading healthcare organization build a model to predict the likelihood of a patient suffering a stroke. The model could help improve a patient’s outcomes.
-
Course by
-
Self Paced
-
3 ساعات
-
الإنجليزية
Advanced Business Analytics Capstone
The analytics process is a collection of interrelated activities that lead to better decisions and to a higher business performance. The capstone of this specialization is designed with the goal of allowing you to experience this process. The capstone project will take you from data to analysis and models, and ultimately to presentation of insights. In this capstone project, you will analyze the data on financial loans to help with the investment decisions of an investment company.
-
Course by
-
Self Paced
-
20 ساعات
-
الإنجليزية

R Tutorial
This comprehensive course is your one-stop-shop for learning the R programming language, a popular tool for data analysis, visualization, and statistical computing. Our course covers all the fundamentals of R, including data types, control structures, functions, and packages. Throughout the course, you'll explore how to import, manipulate, and visualize data using R. Plus, you'll learn how to perform statistical analyses and create custom graphics. By the end of this course, you'll have a solid foundation in R programming and be able to use it for a wide range of data analysis tasks.
-
Course by
-
Self Paced
-
12 ساعات
-
الإنجليزية

Probability & Statistics for Machine Learning & Data Science
Newly updated for 2024! Mathematics for Machine Learning and Data Science is a foundational online program created by DeepLearning.AI and taught by Luis Serrano. In machine learning, you apply math concepts through programming. And so, in this specialization, you’ll apply the math concepts you learn using Python programming in hands-on lab exercises.
-
Course by
-
Self Paced
-
29 ساعات
-
الإنجليزية
Avoiding Data Science Pitfalls
In this 2-hour long project-based course, you will learn some important statistical concepts with examples & visuals, concepts that are most commonly mistaken in data analysis and how to ensure you don’t fall for them.
-
Course by
-
Self Paced
-
3 ساعات
-
الإنجليزية

Regression Analysis with Yellowbrick
Welcome to this project-based course on Regression Analysis with Yellowbrick. In this project, we will build a machine learning model to predict the compressive strength of high performance concrete (HPC). Although, we will use linear regression, the emphasis of this project will be on using visualization techniques to steer our machine learning workflow. Visualization plays a crucial role throughout the analytical process. It is indispensable for any effective analysis, model selection, and evaluation. This project will make use of a diagnostic platform called Yellowbrick.
-
Course by
-
Self Paced
-
3 ساعات
-
الإنجليزية

ESG Data & Accountability
In this course, we’ll introduce students with basic knowledge of traditional financial products to data-driven resources they can use to complement their fundamental analysis.
-
Course by
-
Self Paced
-
20 ساعات
-
الإنجليزية

Advanced R Programming
This course covers advanced topics in R programming that are necessary for developing powerful, robust, and reusable data science tools. Topics covered include functional programming in R, robust error handling, object oriented programming, profiling and benchmarking, debugging, and proper design of functions. Upon completing this course you will be able to identify and abstract common data analysis tasks and to encapsulate them in user-facing functions.
-
Course by
-
Self Paced
-
18 ساعات
-
الإنجليزية

Using Basic Formulas and Functions in Microsoft Excel
Have you started using spreadsheets like Excel and want to learn how to write formulas and functions to perform simple data analysis? In this project, you will learn about the general format for writing formulas and functions in Excel to perform analysis on the sales data from a sample company. In this analysis, you will calculate total sums of profits, you will learn how to use functions to analyze the popularity of the items sold and you will also learn how to calculate averages and percentages of monthly profits.
-
Course by
-
Self Paced
-
3 ساعات
-
الإنجليزية

Data Manipulation at Scale: Systems and Algorithms
Data analysis has replaced data acquisition as the bottleneck to evidence-based decision making --- we are drowning in it. Extracting knowledge from large, heterogeneous, and noisy datasets requires not only powerful computing resources, but the programming abstractions to use them effectively.
-
Course by
-
Self Paced
-
20 ساعات
-
الإنجليزية
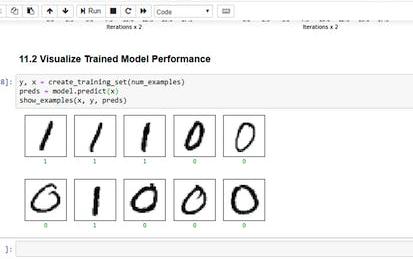
Visualizing & Communicating Results in Python with Jupyter
Code and run your first Python program in minutes without installing anything! This course is designed for learners with limited coding experience, providing a foundation for presenting data using visualization tools in Jupyter Notebook. This course helps learners describe and make inferences from data, and better communicate and present data. The modules in this course will cover a wide range of visualizations which allow you to illustrate and compare the composition of the dataset, determine the distribution of the dataset, and visualize complex data such as geographically-based data.
-
Course by
-
Self Paced
-
11 ساعات
-
الإنجليزية
Logistic Regression with Python and Numpy
Welcome to this project-based course on Logistic with NumPy and Python. In this project, you will do all the machine learning without using any of the popular machine learning libraries such as scikit-learn and statsmodels. The aim of this project and is to implement all the machinery, including gradient descent, cost function, and logistic regression, of the various learning algorithms yourself, so you have a deeper understanding of the fundamentals.
-
Course by
-
Self Paced
-
4 ساعات
-
الإنجليزية
Fundamental Tools of Data Wrangling
Data wrangling is a crucial step in the data analysis process, as it involves the transformation and preparation of raw data into a suitable format for analysis. The "Fundamental Tools for Data Wrangling" course is designed to provide participants with essential skills and knowledge to effectively manipulate, clean, and analyze data. Participants will be introduced to the fundamental tools commonly used in data wrangling, including Python, data structures, NumPy, and pandas.
-
Course by
-
Self Paced
-
27 ساعات
-
الإنجليزية
Conducting Exploratory Data Analysis
Conduct exploratory data analysis with a systematic approach to investigate different aspects of your data: comparisons, relationships, compositions, and distributions. This guided project gives you a framework so you can conduct your own exploratory data analysis and make your work more professional and organized. The language is Python and the libraries used are seaborn, pandas, and matplotlib.
-
Course by
-
Self Paced
-
3 ساعات
-
الإنجليزية

Introduction to Business Analysis Using Spreadsheets: Basics
In this 1-hour 30-mins long project-based course, you will learn the responsibilities of a Business Analyst such as Learn the basic concepts of data analysis and descriptive statistics. Learn how to manipulate, analyze, and visualize data in Google Sheets using functions, aggregation functions, and logical aggregation functions.
-
Course by
-
Self Paced
-
3 ساعات
-
الإنجليزية
Research Design: Inquiry and Discovery
The main purpose of this course is to focus on good questions and how to answer them. This is essential to making considered decisions as a leader in any organization or in your life overall. Topics will include the basis of human curiosity, development of questions, connections between questions and approaches to information gathering design , variable measurement, sampling, the differences between experimental and non-experimental designs, data analysis, reporting and the ethics of inquiry projects.
-
Course by
-
Self Paced
-
9 ساعات
-
الإنجليزية
Data Analysis in Python with pandas & matplotlib in Spyder
Code and run your first Python script in minutes without installing anything! This course is designed for learners with no coding experience, providing a crash course in Python, which enables the learners to delve into core data analysis topics that can be transferred to other languages.
-
Course by
-
Self Paced
-
11 ساعات
-
الإنجليزية
Confluent: Clickstream Data Analysis Pipeline Using ksqlDB
This is a self-paced lab that takes place in the Google Cloud console. This lab will cover how to create a clickstream data analysis pipeline using ksqlDB.
-
Course by
-
Self Paced
-
1 ساعات
-
الإنجليزية

How to use Custom and Conditional Formatting in Excel
By the end of this project, you will learn how to use conditional and custom formatting in an Excel Spreadsheet by using a free version of Microsoft Office Excel. Excel is a spreadsheet that is similar in layout as accounting spreadsheets. It consists of individual cells that can be used to build functions, formulas, tables, and graphs that easily organize and analyze large amounts of information and data. Conditional formatting is a convenient tool for data analysis and visual representation of results. Knowing how to use this tool will save you a lot of time and effort.
-
Course by
-
Self Paced
-
3 ساعات
-
الإنجليزية
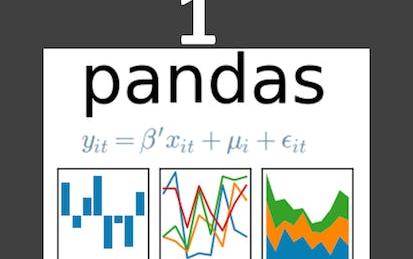
Mastering Data Analysis with Pandas
In this structured series of hands-on guided projects, we will master the fundamentals of data analysis and manipulation with Pandas and Python. Pandas is a super powerful, fast, flexible and easy to use open-source data analysis and manipulation tool. This guided project is the first of a series of multiple guided projects (learning path) that is designed for anyone who wants to master data analysis with pandas. Note: This course works best for learners who are based in the North America region. We’re currently working on providing the same experience in other regions.
-
Course by
-
Self Paced
-
4 ساعات
-
الإنجليزية
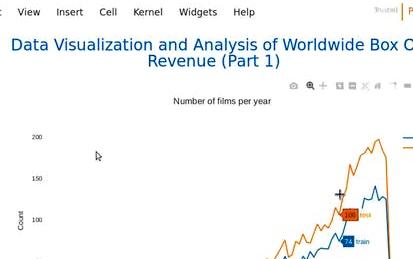
Analyze Box Office Data with Seaborn and Python
Welcome to this project-based course on Analyzing Box Office Data with Seaborn and Python. In this course, you will be working with the The Movie Database (TMDB) Box Office Prediction data set. The motion picture industry is raking in more revenue than ever with its expansive growth the world over. Can we build models to accurately predict movie revenue? Could the results from these models be used to further increase revenue? We try to answer these questions by way of exploratory data analysis (EDA) in this project and the next.
-
Course by
-
Self Paced
-
3 ساعات
-
الإنجليزية
Measuring and Modeling Impact in Evaluations
We want to provide you some information about our course “Measuring and Modeling Impact in evaluations”. The purpose of this course is to give you a better understanding of different measures of impact that could be used in the evaluation of a program in the areas of maternal and child health and nutrition. For each of the measures presented, we will discuss current sources of data you might draw on as well as describe the methods that can be used to measure these.
-
Course by
-
Self Paced
-
14 ساعات
-
الإنجليزية
Machine Learning with Apache Spark
Explore the exciting world of machine learning with this IBM course. Start by learning ML fundamentals before unlocking the power of Apache Spark to build and deploy ML models for data engineering applications. Dive into supervised and unsupervised learning techniques and discover the revolutionary possibilities of Generative AI through instructional readings and videos. Gain hands-on experience with Spark structured streaming, develop an understanding of data engineering and ML pipelines, and become proficient in evaluating ML models using SparkML.
-
Course by
-
Self Paced
-
15 ساعات
-
الإنجليزية

Bank Loan Approval Prediction With Artificial Neural Nets
In this hands-on project, we will build and train a simple deep neural network model to predict the approval of personal loan for a person based on features like age, experience, income, locations, family, education, exiting mortgage, credit card etc.
By the end of this project, you will be able to:
- Understand the applications of Artificial Intelligence and Machine Learning techniques in the banking industry
- Understand the theory and intuition behind Deep Neural Networks
- Import key Python libraries, dataset, and perform Exploratory Data Analysis.
-
Course by
-
Self Paced
-
3 ساعات
-
الإنجليزية