


Generative AI for Business Leaders
Advertising with Meta
How Google does Machine Learning


دوراتنا
Performing Confirmatory Data Analysis in R
Welcome to this project-based course Performing Confirmatory Data Analysis in R. In this project, you will learn how to perform extensive confirmatory data analysis, which is similar to performing inferential statistics in R.
-
Course by

-
 Self Paced
-
 3 ساعات
-
 الإنجليزية

Qlik Sense for Beginners: Analyze and Visualize Data
In this hands-on project, learners will develop the essential skillset to excel in data analysis and storytelling using Qlik Sense. Through guided instruction, learners will become proficient in navigating the Qlik Sense platform, harnessing its powerful features, and efficiently loading data for analysis. By integrating multiple datasets, learners will conduct a comprehensive customer churn analysis, capitalizing on Qlik Sense's Auto-Analysis capabilities to uncover meaningful patterns, derive insights, and make informed business decisions.
-
Course by
-
Self Paced
-
4 ساعات
-
الإنجليزية

A Scientific Approach to Innovation Management
How can innovators understand if their idea is worth developing and pursuing? In this course, we lay out a systematic process to make strategic decisions about innovative product or services that will help entrepreneurs, managers and innovators to avoid common pitfalls. We teach students to assess the feasibility of an innovative idea through problem-framing techniques and rigorous data analysis labelled ‘a scientific approach’. The course is highly interactive and includes exercises and real-world applications.
-
Course by
-
Self Paced
-
14 ساعات
-
الإنجليزية

Machine Learning for Data Analysis
Are you interested in predicting future outcomes using your data? This course helps you do just that! Machine learning is the process of developing, testing, and applying predictive algorithms to achieve this goal. Make sure to familiarize yourself with course 3 of this specialization before diving into these machine learning concepts.
-
Course by
-
Self Paced
-
11 ساعات
-
الإنجليزية
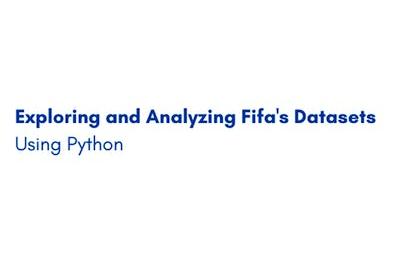
Exploring and Analyzing Fifa's Datasets Using Python
In this 1-hour long project-based course, you will learn how to load a dataset into a pandas dataframe, you will learn how to tidy a messy dataset (Data Tidying), you will get to also visualize the dataset using Matplotlib and seaborn, you will learn how to engineer new features, you will also get to learn how to merge datasets (Data Integration)
-
Course by
-
Self Paced
-
2 ساعات
-
الإنجليزية

Big Data Analytical Platform on Alibaba Cloud
Course Description Building an Analytical Platform on Alibaba Cloud can empower how you take in, analyze, and demonstrate clear metrics from a set of Big Data. This course is designed to teach engineers how to use Alibaba Cloud Big Data products.
-
Course by
-
Self Paced
-
8 ساعات
-
الإنجليزية

Pre-MBA Quantitative Skills: Data Analysis
This course will equip students with the quantitative skills needed to begin any Masters of Business Administration program. The goal is not to build foundational skills or expert mastery but rather, to provide some middle ground to “shake the rust off” skills that a typical MBA student probably knows, but may not have thought about for quite some time. The course provides a quick refresher on top level math and statistics concepts that will be used throughout the MBA curriculum at any school. All of the concepts will be reinforced with practical real-world examples.
-
Course by
-
Self Paced
-
19 ساعات
-
الإنجليزية
AI Workflow: Data Analysis and Hypothesis Testing
This is the second course in the IBM AI Enterprise Workflow Certification specialization. You are STRONGLY encouraged to complete these courses in order as they are not individual independent courses, but part of a workflow where each course builds on the previous ones. In this course you will begin your work for a hypothetical streaming media company by doing exploratory data analysis (EDA). Best practices for data visualization, handling missing data, and hypothesis testing will be introduced to you as part of your work. You will learn techniques of estimation
-
Course by
-
Self Paced
-
11 ساعات
-
الإنجليزية

Big Data Analysis to a Slide Presentation
This is a self-paced lab that takes place in the Google Cloud console. This lab leverages two Google developer platforms: G Suite and Google Cloud Platform (GCP). It uses GCP's BigQuery API, Sheets, and Slides to collect, analyze and present data.
-
Course by
-
Self Paced
-
1 ساعات
-
الإنجليزية

Perform exploratory data analysis on retail data with Python
In this project, you'll serve as a data analyst at an online retail company helping interpret real-world data to help make key business decisions. Your task is to explore and analyze this dataset to gain insights into the store's sales trends, customer behavior, and popular products.
-
Course by
-
Self Paced
-
3 ساعات
-
الإنجليزية
Calculus through Data & Modelling: Vector Calculus
This course continues your study of calculus by focusing on the applications of integration to vector valued functions, or vector fields. These are functions that assign vectors to points in space, allowing us to develop advanced theories to then apply to real-world problems. We define line integrals, which can be used to fund the work done by a vector field. We culminate this course with Green's Theorem, which describes the relationship between certain kinds of line integrals on closed paths and double integrals.
-
Course by
-
Self Paced
-
5 ساعات
-
الإنجليزية
Logistic Regression with NumPy and Python
Welcome to this project-based course on Logistic with NumPy and Python. In this project, you will do all the machine learning without using any of the popular machine learning libraries such as scikit-learn and statsmodels. The aim of this project and is to implement all the machinery, including gradient descent, cost function, and logistic regression, of the various learning algorithms yourself, so you have a deeper understanding of the fundamentals.
-
Course by
-
Self Paced
-
2 ساعات
-
الإنجليزية
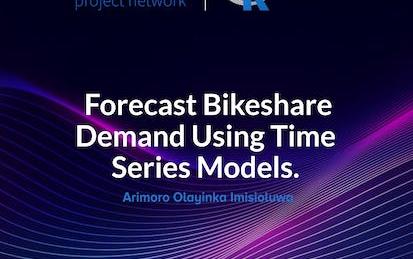
Forecast bikeshare demand using time series models in R
In this project, you’ll help a bike rental company enhance its fleet management and pricing strategy by building a daily bike rental forecasting model using time series analysis techniques in R. Your objectives include loading, cleaning, processing, and analyzing daily rental transaction data, and developing and evaluating time series models for the most accurate predictions. The company will use your validated forecasting model to determine the optimal number of bikes to keep in each station and set dynamic pricing based on predicted demand.
-
Course by
-
Self Paced
-
3 ساعات
-
الإنجليزية
Politics and Ethics of Data Analytics in the Public Sector
Deepen your understanding of the power and politics of data in the public sector, including how values — in addition to data and evidence — are always part of public sector decision-making. In this course, you will explore common ethical challenges associated with data, data analytics, and randomized controlled trials in the public sector. You will also navigate and understand the ethical issues related to data systems and data analysis by understanding frameworks, codes of ethics, and professional guidelines.
-
Course by
-
Self Paced
-
14 ساعات
-
الإنجليزية
Introduction to High-Performance and Parallel Computing
This course introduces the fundamentals of high-performance and parallel computing. It is targeted to scientists, engineers, scholars, really everyone seeking to develop the software skills necessary for work in parallel software environments. These skills include big-data analysis, machine learning, parallel programming, and optimization. We will cover the basics of Linux environments and bash scripting all the way to high throughput computing and parallelizing code. We recommend you are familiar with either Fortran 90, C++, or Python to complete some of the programming assignments.
-
Course by
-
Self Paced
-
14 ساعات
-
الإنجليزية
Advanced Models for Decision Making
Business analysts need to be able to prescribe optimal solution to problems. But analytics courses are often focused on training students in data analysis and visualization, not so much in helping them figure out how to take the available data and pair that with the right mathematical model to formulate a solution. This course is designed to connect data and models to real world decision-making scenarios in manufacturing, supply chain, finance, human resource management, etc.
-
Course by
-
Self Paced
-
14 ساعات
-
الإنجليزية

Image Compression with K-Means Clustering
In this project, you will apply the k-means clustering unsupervised learning algorithm using scikit-learn and Python to build an image compression application with interactive controls.
-
Course by
-
Self Paced
-
3 ساعات
-
الإنجليزية
Precalculus: Periodic Functions
This course helps to build the foundational material to use mathematics as a tool to model, understand, and interpret the world around us. This is done through studying functions, their properties, and applications to data analysis. Concepts of precalculus provide the set of tools for the beginning student to begin their scientific career, preparing them for future science and calculus courses. This course is designed for all students, not just those interested in further mathematics courses.
-
Course by
-
Self Paced
-
9 ساعات
-
الإنجليزية
Follow a Machine Learning Workflow
Machine learning is not just a single task or even a small group of tasks; it is an entire process, one that practitioners must follow from beginning to end. It is this process—also called a workflow—that enables the organization to get the most useful results out of their machine learning technologies. No matter what form the final product or service takes, leveraging the workflow is key to the success of the business's AI solution.
-
Course by
-
Self Paced
-
20 ساعات
-
الإنجليزية

Supervised Machine Learning: Regression
This course introduces you to one of the main types of modelling families of supervised Machine Learning: Regression. You will learn how to train regression models to predict continuous outcomes and how to use error metrics to compare across different models.
-
Course by
-
Self Paced
-
21 ساعات
-
الإنجليزية

Introduction to R Programming and Tidyverse
This course is a gentle introduction to programming in R designed for 3 types of learners. It will be right for you, if: • you want to do data analysis but don’t know programming • you know programming but aren’t familiar with R • you know some R programming but want to learn the tidyverse verbs You will learn to do data visualization and analysis in a reproducible manner and use functions that allow your code to be easily read and understood.
-
Course by
-
Self Paced
-
23 ساعات
-
الإنجليزية
Generate a Report with LibreOffice Base
By the end of this project you will have used LibreOffice to create a variety of reports for displaying data that originates in relational tables. A report provides a way for users to view only the data they need, and in the format that makes data analysis most effective.
Note: This course works best for learners who are based in the North America region. We’re currently working on providing the same experience in other regions.
-
Course by
-
Self Paced
-
3 ساعات
-
الإنجليزية
Exploratory Data Analysis Using AI Platform
This is a self-paced lab that takes place in the Google Cloud console. Learn the process of analyzing a data set stored in BigQuery using AI Platform to perform queries and present the data using various statistical plot…
-
Course by
-
Self Paced
-
الإنجليزية
Introduction to R Programming for Data Science
When working in the data science field you will definitely become acquainted with the R language and the role it plays in data analysis. This course introduces you to the basics of the R language such as data types, techniques for manipulation, and how to implement fundamental programming tasks. You will begin the process of understanding common data structures, programming fundamentals and how to manipulate data all with the help of the R programming language. The emphasis in this course is hands-on and practical learning .
-
Course by
-
Self Paced
-
11 ساعات
-
الإنجليزية
Panel Data Analysis with R
In this 1-hour long project-based course, you will learn how to conduct Panel Data (Regression) Analysis. You will receive step-by-step instructions to analyze the 'RENTAL' dataset from 'Introductory Econometrics: A Modern Approach' by Wooldridge using R Studio. In this project, we will discuss three models namely, Ordinary Least Square (OLS), Fixed effects (FE) and Random effects (RE) in brief and check which one fits the model best.
-
Course by
-
Self Paced
-
2 ساعات
-
الإنجليزية