- Level Professional
- المدة 2 ساعات hours
-
Offered by

عن
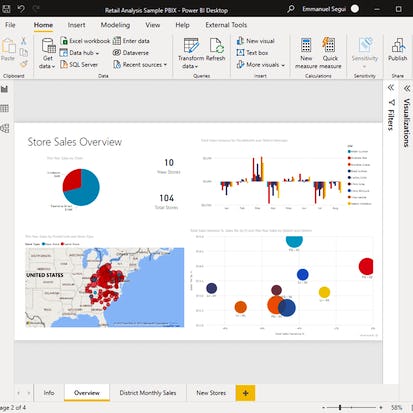
Connect Power BI to different sources to create interactive dashboards in Power BI. For example, a data analyst can build a dashboard that is interactive and can track key business metrics to help business stakeholders make actionable business decisions.Auto Summary
Unlock the power of data with "Data Visualization in Power BI: Create Your First Dashboard". This professional-level course, offered by Coursera, focuses on connecting Power BI to various data sources to create interactive and insightful dashboards. Over 120 minutes, you'll learn to build dashboards that track key business metrics, enabling actionable decisions for stakeholders. Ideal for data analysts, this course is available through a Starter subscription. Join now to enhance your data visualization skills and drive business success.

