- Level Intermediate
- المدة 3 ساعات hours
- الطبع بواسطة Coursera
-
Offered by

عن
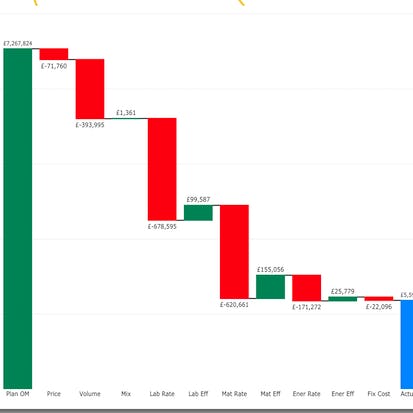
This Guided Project 'Financial Analytics in RStudio: Identify Profit Drivers' is for Supply Chain and/or Operations Analysts. In this 2-hour long project-based course, you will learn how to determine operational & financial performance, calculate Operating Margin (OM), and plot OM waterfall chart showing OM variance drivers.الوحدات
Your Learning Journey
1
Assignment
- Assess Your Knowledge
1
Labs
- Financial Analytics in RStudio: Identify Profit Drivers
2
Readings
- Project Overview
- R Script, Data & Slides
Auto Summary
"Financial Analytics in RStudio: Identify Profit Drivers" is an intermediate-level course ideal for Supply Chain and Operations Analysts. In just 2 hours, you'll master determining operational and financial performance, calculating Operating Margin (OM), and plotting OM waterfall charts to show variance drivers. Offered by Coursera, this data science and AI course is available for free, guided by expert instructors. Perfect for those looking to enhance their analytical skills in RStudio.

Instructor
Moses Gummadi


