Buy Now Free
- Level Professional
- المدة 3 ساعات hours
-
Offered by

عن
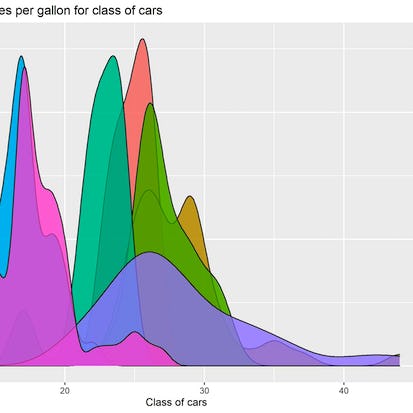
Welcome to this project-based course Introduction to EDA in R. In this project, you will learn how to perform extensive exploratory data analysis on both quantitative and qualitative variables using basic R functions. By the end of this 2-hour long project, you will understand how to create different basic plots in R. Also, you will learn how to create plots for categorical variables and numeric or quantitative variables. By extension, you will learn how to plot three variables and save your plot as an image in R. Note, you do not need to be a data scientist to be successful in this guided project, just a familiarity with basic statistics and using R suffice for this project. If you are not familiar with R and want to learn the basics, start with my previous guided projects titled “Getting Started with R” and “Calculating Descriptive Statistics in R”Auto Summary
"Introduction to EDA in R" is a dynamic, project-based course offered by Coursera, designed for those looking to deepen their expertise in the domain of Data Science and AI. Guided by experienced instructors, this intermediate-level course focuses on Exploratory Data Analysis (EDA) using the R programming language. Over the span of 180 minutes, learners will engage with practical, hands-on content that allows them to apply EDA techniques to real-world datasets. With a free subscription option available, this course is ideal for individuals aiming to enhance their data analysis skills and gain a robust understanding of EDA in R. Whether you're a data enthusiast or a professional seeking to expand your toolkit, this course provides valuable insights and practical knowledge to advance your data science journey.