


Generative AI for Business Leaders
Advertising with Meta
How Google does Machine Learning


دوراتنا

Define Product Vision with User Experience Maps in Miro
By the end of this project, you will be able to define product vision with user experience maps in Miro.
To understand the User Experience design principles and create a visualization that defines the product vision, you will gain hands-on experience exercising empathy to accurately document the user experience (UX). You will also leverage design thinking, user interface (UI) knowledge, and context from the user’s experience as you create a map in the Miro online visual collaboration platform for teamwork.
-
Course by

-
 Self Paced
-
 3 ساعات
-
 الإنجليزية

Consulting Presentations and Storytelling
This is the #5 course in the specialization on management consulting. In the previous 4 courses, we’ve learned how consultants break down problems with tools and logical thinking. Now, it’s time to bring all the parts together into consulting-quality presentations and deliverables.
-
Course by
-
Self Paced
-
7 ساعات
-
الإنجليزية

Data Visualization in Microsoft PowerPoint
At the end of this project you will be able to create a simple PowerPoint presentation from scratch using different basic elements. First, you will learn how to create your PowerPoint presentation using text. Then, you will get to know options to improve your presentation by adding images and other visuals. Additionally, you will learn a few easy methods to make your slide transitions smoother and more appealing to your audience. Creating a Microsoft PowerPoint will allow you to be able to have the best visual support possible during your presentation.
-
Course by
-
Self Paced
-
2 ساعات
-
الإنجليزية

Business Intelligence and Visual Analytics
Building on “Data Warehousing and Business Intelligence,” this course focuses on data visualization and visual analytics. Starting with a thorough coverage of what data visualization is and what type of visualization is good for a given purpose, the course quickly dives into development of practical skills and knowledge about visual analytics by way of using one of the most popular visual analytics tools: SAS Viya, a cloud-based analytics platform. An overview of cloud architecture, automation, and machine learning is also provided.
-
Course by
-
Self Paced
-
12 ساعات
-
الإنجليزية
Scrape and analyze data analyst job requirements with Python
In this project, you’ll help a recruitment agency improve its job vacancy sourcing by using Python’s web-scraping capabilities to extract job postings from multiple sites. This task will require you to write a Python script to extract job posting data from the source site and save it to a comma separated values (CSV) file.
-
Course by
-
Self Paced
-
2 ساعات
-
الإنجليزية
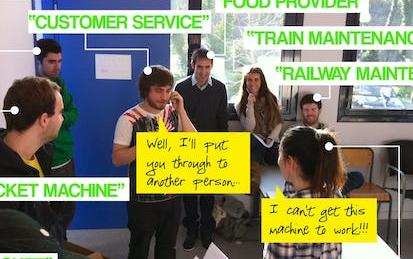
Identify UX Opportunities with Service Blueprints in Miro
By the end of this project, you will be able to design a service blueprint that serves as a point of shared understanding, informs a smooth service process, and collects quantifiable metrics to identify opportunities for continuous improvements.
To identify UX opportunities with a service blueprint visualization, you will gain hands-on experience applying design thinking, user interface knowledge, context from each step of the customer experience, and business intelligence integrations in the Miro online visual collaboration platform for teamwork.
-
Course by
-
Self Paced
-
2 ساعات
-
الإنجليزية
Exploring and Analyzing Fifa's Datasets Using Python
In this 1-hour long project-based course, you will learn how to load a dataset into a pandas dataframe, you will learn how to tidy a messy dataset (Data Tidying), you will get to also visualize the dataset using Matplotlib and seaborn, you will learn how to engineer new features, you will also get to learn how to merge datasets (Data Integration)
-
Course by
-
Self Paced
-
2 ساعات
-
الإنجليزية

AI Workflow: Data Analysis and Hypothesis Testing
This is the second course in the IBM AI Enterprise Workflow Certification specialization. You are STRONGLY encouraged to complete these courses in order as they are not individual independent courses, but part of a workflow where each course builds on the previous ones. In this course you will begin your work for a hypothetical streaming media company by doing exploratory data analysis (EDA). Best practices for data visualization, handling missing data, and hypothesis testing will be introduced to you as part of your work. You will learn techniques of estimation
-
Course by
-
Self Paced
-
11 ساعات
-
الإنجليزية
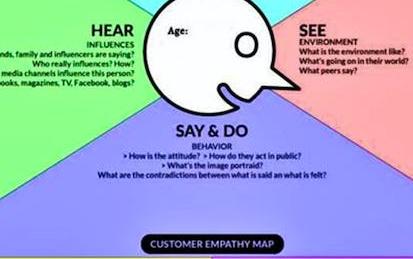
Communicate UX Research with Empathy Maps in Miro
By the end of this project, you will be able to leverage applied empathy to interpret User Experience research so that it can be effectively communicated within an empathy map visualization. To do this, you will gain hands-on experience applying design thinking, empathy, and context from User Experience research to create an empathy map in the Miro online visual collaboration platform for teamwork. Note: This course works best for learners who are based in the North America region. We’re currently working on providing the same experience in other regions.
-
Course by
-
Self Paced
-
2 ساعات
-
الإنجليزية

Analyze Survey Data with Tableau
Surveys are used in a variety of scenarios, both in businesses and in research. Companies are using them to better understand consumer insights and feedback, and researchers are going beyond the traditional uses to learn more about the world around us. Tableau can help visualize survey data of all kinds in a useful way—without needing advanced statistics, graphic design, or a statistics background.
-
Course by
-
Self Paced
-
3 ساعات
-
الإنجليزية

Perform exploratory data analysis on retail data with Python
In this project, you'll serve as a data analyst at an online retail company helping interpret real-world data to help make key business decisions. Your task is to explore and analyze this dataset to gain insights into the store's sales trends, customer behavior, and popular products.
-
Course by
-
Self Paced
-
3 ساعات
-
الإنجليزية
Applying Data Analytics in Accounting
This course explores business analytic applications in accounting. First, it presents a survey of technology topics in accounting, including process mining, blockchain and applications in audit, tax, and assurance. Next, the course explores visualization and basic analytics in audit and control testing using R and Alteryx. Next, the course examines the uses of text analysis in accounting and conducts text analysis using R and RStudio. Finally, the course examines robot process automation in general using UiPath and its applications in accounting.
-
Course by
-
Self Paced
-
14 ساعات
-
الإنجليزية

Research Report: Delivering Insights
You have completed all the hard work of conducting your internal, secondary, and primary research. You have analyzed all the data and are able to formulate insights and recommendations based on your research proposal. But what is the best way to present your findings and be able to make a decision? In this course, you will discuss how to incorporate a story in your marketing presentation to help you capture the attention and gain support of stakeholders and business leaders.
-
Course by
-
Self Paced
-
15 ساعات
-
الإنجليزية

Applied Analytics and Data for Decision Making
By the end of this course, learners are prepared to identify and test the best solutions for improving performance and integrating concepts from operational excellence methodologies for optimum data-driven decision making. The course begins with a focus on deciphering the root cause of problems through a variety of tools before determining and assessing best-fit solutions. Learners discover how to apply ISO, Lean and Six Sigma in the pursuit of aligning organizational operations data with performance standards.
-
Course by
-
Self Paced
-
11 ساعات
-
الإنجليزية
Google Advanced Data Analytics Capstone
You’re almost there! This is the seventh and final course of the Google Advanced Data Analytics Certificate. In this course, you have the opportunity to complete an optional capstone project that includes key concepts from each of the six preceding courses.
-
Course by
-
Self Paced
-
10 ساعات
-
الإنجليزية
Forecast bikeshare demand using time series models in R
In this project, you’ll help a bike rental company enhance its fleet management and pricing strategy by building a daily bike rental forecasting model using time series analysis techniques in R. Your objectives include loading, cleaning, processing, and analyzing daily rental transaction data, and developing and evaluating time series models for the most accurate predictions. The company will use your validated forecasting model to determine the optimal number of bikes to keep in each station and set dynamic pricing based on predicted demand.
-
Course by
-
Self Paced
-
3 ساعات
-
الإنجليزية
Politics and Ethics of Data Analytics in the Public Sector
Deepen your understanding of the power and politics of data in the public sector, including how values — in addition to data and evidence — are always part of public sector decision-making. In this course, you will explore common ethical challenges associated with data, data analytics, and randomized controlled trials in the public sector. You will also navigate and understand the ethical issues related to data systems and data analysis by understanding frameworks, codes of ethics, and professional guidelines.
-
Course by
-
Self Paced
-
14 ساعات
-
الإنجليزية
Advanced Models for Decision Making
Business analysts need to be able to prescribe optimal solution to problems. But analytics courses are often focused on training students in data analysis and visualization, not so much in helping them figure out how to take the available data and pair that with the right mathematical model to formulate a solution. This course is designed to connect data and models to real world decision-making scenarios in manufacturing, supply chain, finance, human resource management, etc.
-
Course by
-
Self Paced
-
14 ساعات
-
الإنجليزية
Clean and analyze social media usage data with Python
In this project, you'll serve as a data analyst at a marketing firm specializing in social media brand promotion.
-
Course by
-
Self Paced
-
2 ساعات
-
الإنجليزية

Image Compression with K-Means Clustering
In this project, you will apply the k-means clustering unsupervised learning algorithm using scikit-learn and Python to build an image compression application with interactive controls.
-
Course by
-
Self Paced
-
3 ساعات
-
الإنجليزية
Plant Bioinformatics
The past 15 years have been exciting ones in plant biology. Hundreds of plant genomes have been sequenced, RNA-seq has enabled transcriptome-wide expression profiling, and a proliferation of "-seq"-based methods has permitted protein-protein and protein-DNA interactions to be determined cheaply and in a high-throughput manner. These data sets in turn allow us to generate hypotheses at the click of a mouse. For instance, knowing where and when a gene is expressed can help us narrow down the phenotypic search space when we don't see a phenotype in a gene mutant under "normal" growth conditions.
-
Course by
-
Self Paced
-
14 ساعات
-
الإنجليزية

Net Promoter Score (NPS) and Sentiment Analysis in Miro
By the end of this project, you will be able to confidently analyze survey data by generating Net Promoter Score analytics to help understand and communicate the state of the overall Customer Experience (CX).
To do this, you will gain hands-on experience leveraging the visualization tools in the Miro online visual collaboration platform for teamwork.
Note: This course works best for learners who are based in the North America region. We’re currently working on providing the same experience in other regions.
-
Course by
-
Self Paced
-
2 ساعات
-
الإنجليزية
Publishing Visualizations in R with Shiny and flexdashboard
Data visualization is a critical skill for anyone that routinely using quantitative data in his or her work - which is to say that data visualization is a tool that almost every worker needs today. One of the critical tools for data visualization today is the R statistical programming language. Especially in conjunction with the tidyverse software packages, R has become an extremely powerful and flexible platform for making figures, tables, and reproducible reports.
-
Course by
-
Self Paced
-
12 ساعات
-
الإنجليزية

Geospatial Big Data Visualization with Kepler GL
In this 1-hour long project-based course, you will learn how to easily create beautiful data visualization with Kepler and effectively design different geospatial data visualizations.
-
Course by
-
Self Paced
-
3 ساعات
-
الإنجليزية
Data Science Companion
The Data Science Companion provides an introduction to data science. You will gain a quick background in data science and core machine learning concepts, such as regression and classification. You’ll be introduced to the practical knowledge of data processing and visualization using low-code solutions, as well as an overview of the ways to integrate multiple tools effectively to solve data science problems. You will then leverage cloud resources from Amazon Web Services to scale data processing and accelerate machine learning model training.
-
Course by
-
Self Paced
-
2 ساعات
-
الإنجليزية