Buy Now Free
- Level Intermediate
- Duration 2 hours
-
Offered by

About
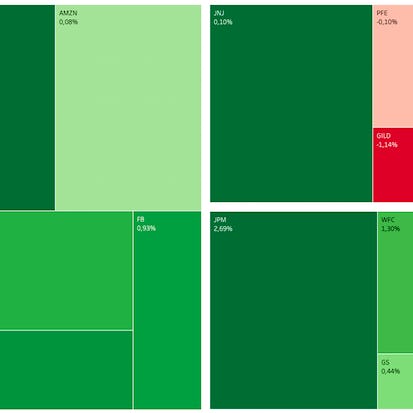
In this 1-hour long project-based course, you will learn how to extract stock data using Google Finance, build a Heat and Treemap in Tableau, build a stock returns dashboard in Tableau. Note: This course works best for learners who are based in the North America region. We're currently working on providing the same experience in other regions. This course's content is not intended to be investment advice and does not constitute an offer to perform any operations in the regulated or unregulated financial market.Auto Summary
Unlock the powerful potential of Tableau with our engaging course, "Building Stock Returns Heatmap with Tableau." Perfect for professionals diving into the world of Big Data and Analytics, this project-based course will guide you through the process of extracting stock data using Google Finance and creating insightful visualizations such as Heatmaps and Treemaps in Tableau. Over 1 hour, you'll develop a comprehensive stock returns dashboard, enhancing your ability to interpret and present financial data effectively. Please note that this course is optimized for learners in North America, with efforts underway to expand its accessibility globally. While the knowledge gained is invaluable, the course content is purely educational and not intended as investment advice. This course, offered by Coursera, is available with a Starter subscription, making it an excellent choice for those looking to advance their professional skills in a short time. Whether you're a data analyst, financial professional, or an enthusiast looking to expand your skill set, this course will provide you with the tools and knowledge to excel in the fast-paced world of data analytics.