- Level Intermediate
- Duration 2 hours
- Course by Coursera
-
Offered by

About
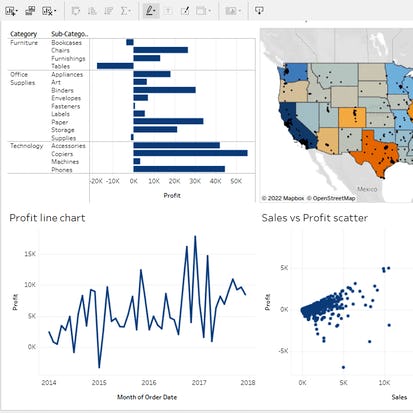
Use Tableau Web Authoring to create best practice dashboards and stories from dataModules
Your Learning Journey
1
Assignment
- Assess Your Knowledge
1
Labs
- Data Visualization in Tableau: Create Dashboards and Stories
1
Readings
- Project Overview
Auto Summary
"Data Visualization in Tableau: Create Dashboards and Stories" is an intermediate course available on Coursera, designed for individuals interested in mastering the art of data visualization within the Big Data and Analytics domain. Through this course, learners will utilize Tableau Web Authoring to develop best practice dashboards and compelling data stories. The course, led by expert instructors, spans over 120 hours of comprehensive content. It is available for free, making it an accessible option for those looking to enhance their data visualization skills and apply them in various professional contexts. Ideal for professionals in the data analytics field, this course provides the tools and knowledge necessary to effectively present data insights and drive informed decision-making.
Eoin Martyn Rando


