


Generative AI for Business Leaders
Advertising with Meta
How Google does Machine Learning


Our Courses
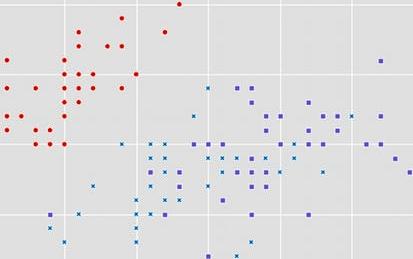
Principal Component Analysis with NumPy
Welcome to this 2 hour long project-based course on Principal Component Analysis with NumPy and Python. In this project, you will do all the machine learning without using any of the popular machine learning libraries such as scikit-learn and statsmodels. The aim of this project and is to implement all the machinery of the various learning algorithms yourself, so you have a deeper understanding of the fundamentals.
-
Course by

-
 Self Paced
-
 3 hours
-
 English

Decisions, Decisions: Dashboards and Reports
You’re almost there! This is the third and final course in the Google Business Intelligence Certificate. In this course, you’ll apply your understanding of stakeholder needs, plan and create BI visuals, and design reporting tools, including dashboards.
-
Course by
-
Self Paced
-
27 hours
-
English
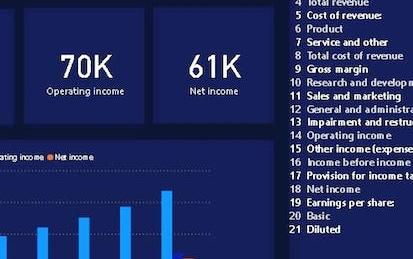
Visualize Financial Data In Tableau
Tableau is widely recognized as one of the premier data visualization software programs.
-
Course by
-
Self Paced
-
2 hours
-
English
Exploratory vs Confirmatory data analysis using Python
This Guided Project, Exploratory and Confirmatory Data Analysis using python, is for those who want to learn about different methods of data analysis. In this 2-hour-long project-based course, you will understand and apply Exploratory Data Analysis, build different Data visualizations, apply different exploration techniques based on the data at hand and define and understand the concept of Confirmatory Data Analysis. This project is unique because you will learn how and where to start your data exploration.
-
Course by
-
Self Paced
-
2 hours
-
English

Assessment for Data Analysis and Visualization Foundations
This course is the final step in the Data Analysis and Visualization Foundations Specialization. It contains a graded final examination that covers content from three courses: Introduction to Data Analytics, Excel Basics for Data Analysis, and Data Visualization and Dashboards with Excel and Cognos. From the Introduction to Data Analytics course, your understanding will be assessed on topics like the data ecosystem and the fundamentals of data analysis, covering tools for data gathering and data mining.
-
Course by
-
Self Paced
-
1 hour
-
English
MLOps Platforms: Amazon SageMaker and Azure ML
In MLOps (Machine Learning Operations) Platforms: Amazon SageMaker and Azure ML you will learn the necessary skills to build, train, and deploy machine learning solutions in a production environment using two leading cloud platforms: Amazon Web Services (AWS) and Microsoft Azure.
-
Course by
-
Self Paced
-
13 hours
-
English

Data Processing Using Python
This course (The English copy of "用Python玩转数据" ) is mainly for non-computer majors. It starts with the basic syntax of Python, to how to acquire data in Python locally and from network, to how to present data, then to how to conduct basic and advanced statistic analysis and visualization of data, and finally to how to design a simple GUI to present and process data, advancing level by level.
-
Course by
-
Self Paced
-
29 hours
-
English
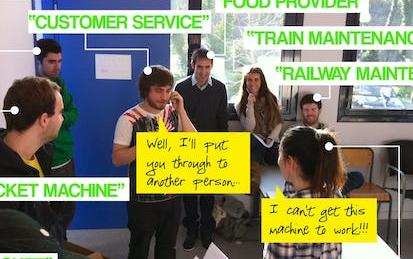
Develop a UX Customer Problem Statement in Miro
By the end of this project, you will be able to create an accurate customer problem statement that diagrams the problem that your brand or product will solve for the customer. The power of creating a customer problem statement is that it becomes business intelligence that can maximize business opportunities by solving user experience problems. It does this by expanding upon the knowledge of the customer’s user experience by empathizing with the customer and the challenges or needs they must meet as a part of their normal life journey.
-
Course by
-
Self Paced
-
3 hours
-
English

Data Analysis Using Python
This course provides an introduction to basic data science techniques using Python. Students are introduced to core concepts like Data Frames and joining data, and learn how to use data analysis libraries like pandas, numpy, and matplotlib. This course provides an overview of loading, inspecting, and querying real-world data, and how to answer basic questions about that data. Students will gain skills in data aggregation and summarization, as well as basic data visualization.
-
Course by
-
Self Paced
-
17 hours
-
English

Tesla Stock Price Prediction using Facebook Prophet
In this 1.5-hour long project-based course, you will learn how to build a Facebook Prophet Machine learning model in order to forecast the price of Tesla 30 days into the future. We will also visualize the historical performance of Tesla through graphs and charts using Plotly express and evaluate the performance of the model against real data using Google Finance in Google Sheets. We will also dive into a brief stock analysis of Tesla and we will discuss PE ratio, EPS, Beta, Market cap, Volume and price range of Tesla.
-
Course by
-
Self Paced
-
4 hours
-
English
Data Visualization Capstone
Data visualization is a critical skill for anyone that routinely using quantitative data in his or her work - which is to say that data visualization is a tool that almost every worker needs today. One of the critical tools for data visualization today is the R statistical programming language. Especially in conjunction with the tidyverse software packages, R has become an extremely powerful and flexible platform for making figures, tables, and reproducible reports.
-
Course by
-
Self Paced
-
22 hours
-
English
Create Geovisualizations in Tableau
Tableau is widely recognized as one of the premier data visualization software programs.
-
Course by
-
Self Paced
-
3 hours
-
English
Empathy and Data in Risk Management
Risk Management and Innovation develops your ability to conduct empathy-driven and data-driven analysis in the domain of risk management. This course focuses on the process of managing enterprise risk, in which understanding both data and stakeholder enriches each step. The course introduces the three lines of defense, tools to identify and assess risks, risk responses, key risk indicators, and risk reporting.
-
Course by
-
Self Paced
-
16 hours
-
English
Designing Engaging Dashboards for Healthcare Analytics
Introduces processes and design principles for creating meaningful displays of information that support effective business decision-making. Studies how to collect and process data; create visualizations (both static and interactive); and use them to provide insight into a problem, situation, or opportunity. Introduces methods to critique visualizations along with ways to answer the elusive question: “What makes a visualization effective?” Discusses the challenges of making data understandable across a wide range of audiences.
-
Course by
-
Self Paced
-
16 hours
-
English
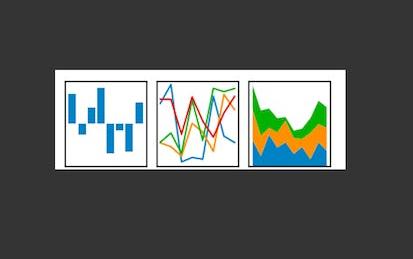
Exploratory Data Analysis with Seaborn
Producing visualizations is an important first step in exploring and analyzing real-world data sets.
-
Course by
-
Self Paced
-
3 hours
-
English
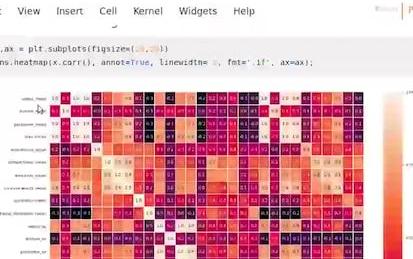
Practical Data Wrangling with Pandas
In this project, we will analyze life expectancy data by performing data wrangling & exploratory data analysis (EDA). Pandas is a powerful open source data analysis tools in python. Exploratory Data Analysis (EDA) is a process of analyzing data to gain valuable insights such as statistical summary & visualizations.
-
Course by
-
Self Paced
-
2 hours
-
English
Database Engineer Capstone
In this course you’ll complete a capstone project in which you’ll create a database and client for Little Lemon restaurant. To complete this course, you will need database engineering experience. The Capstone project enables you to demonstrate multiple skills from the Certificate by solving an authentic real-world problem. Each module includes a brief recap of, and links to, content that you have covered in previous courses in this program.
-
Course by
-
Self Paced
-
18 hours
-
English

Data Analysis with Python Project
The "Data Analysis Project" course empowers students to apply their knowledge and skills gained in this specialization to conduct a real-life data analysis project of their interest. Participants will explore various directions in data analysis, including supervised and unsupervised learning, regression, clustering, dimension reduction, association rules, and outlier detection. Throughout the modules, students will learn essential data analysis techniques and methodologies and embark on a journey from raw data to knowledge and intelligence.
-
Course by
-
Self Paced
-
18 hours
-
English
Tools for Exploratory Data Analysis in Business
This course introduces several tools for processing business data to obtain actionable insight. The most important tool is the mind of the data analyst. Accordingly, in this course, you will explore what it means to have an analytic mindset. You will also practice identifying business problems that can be answered using data analytics. You will then be introduced to various software platforms to extract, transform, and load (ETL) data into tools for conducting exploratory data analytics (EDA).
-
Course by
-
Self Paced
-
19 hours
-
English

3D SARS-CoV-19 Protein Visualization With Biopython
In this project you will create an interactive three-dimensional (3D) representation of SARS-CoV-19 (Coronavirus) protein structures & publication-quality pictures of the same, understand properties of SARS-CoV-19 genome, handle biological sequence data stored in FASTA & PDB (Protein Data Bank) and XML format, and get insights from this data using Biopython.
-
Course by
-
Self Paced
-
3 hours
-
English

Getting Started with Data Visualization in R
Data visualization is a critical skill for anyone that routinely using quantitative data in his or her work - which is to say that data visualization is a tool that almost every worker needs today. One of the critical tools for data visualization today is the R statistical programming language. Especially in conjunction with the tidyverse software packages, R has become an extremely powerful and flexible platform for making figures, tables, and reproducible reports.
-
Course by
-
Self Paced
-
12 hours
-
English
Social Determinants of Health: Planetary Health
This fifth and final course is centered on planetary health as a fundamental health determinant. As we consider how the health of humans is dependent on the health of Earth’s natural systems, we will also explore how to apply futures thinking and foresight principles to planetary health initiatives. The topics of this course include: 1. Introduction to Planetary Health 2. Values and Sources of Knowledge 3. Action and Movement Building 4. Foresight 5. Data Applications: Regression Analysis and Scatter Plot Visualization
-
Course by
-
Self Paced
-
17 hours
-
English
Consulting Presentations and Storytelling
This is the #5 course in the specialization on management consulting. In the previous 4 courses, we’ve learned how consultants break down problems with tools and logical thinking. Now, it’s time to bring all the parts together into consulting-quality presentations and deliverables.
-
Course by
-
Self Paced
-
7 hours
-
English

Data Visualization in Microsoft PowerPoint
At the end of this project you will be able to create a simple PowerPoint presentation from scratch using different basic elements. First, you will learn how to create your PowerPoint presentation using text. Then, you will get to know options to improve your presentation by adding images and other visuals. Additionally, you will learn a few easy methods to make your slide transitions smoother and more appealing to your audience. Creating a Microsoft PowerPoint will allow you to be able to have the best visual support possible during your presentation.
-
Course by
-
Self Paced
-
2 hours
-
English
Business Intelligence and Visual Analytics
Building on “Data Warehousing and Business Intelligence,” this course focuses on data visualization and visual analytics. Starting with a thorough coverage of what data visualization is and what type of visualization is good for a given purpose, the course quickly dives into development of practical skills and knowledge about visual analytics by way of using one of the most popular visual analytics tools: SAS Viya, a cloud-based analytics platform. An overview of cloud architecture, automation, and machine learning is also provided.
-
Course by
-
Self Paced
-
12 hours
-
English