Buy Now Free
- Level Beginner
- Duration 2 hours
-
Offered by

About
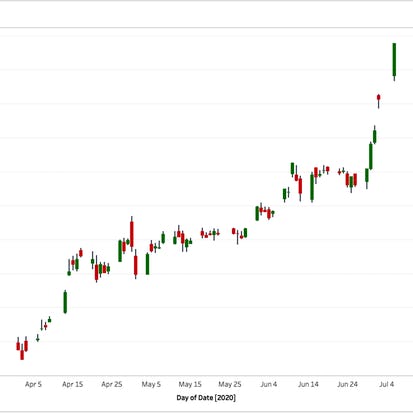
In this 1-hour long project-based course, you will learn how to use Python YFinance to extract stock price data and how to use Tableau to build a japanese candlestick chart. Note: This course works best for learners who are based in the North America region. We're currently working on providing the same experience in other regions. This course's content is not intended to be investment advice and does not constitute an offer to perform any operations in the regulated or unregulated financial marketAuto Summary
Unlock the power of data visualization with "Building Candlestick Charts with Tableau," a beginner-friendly course in the Data Science & AI domain offered by Coursera. In just 1 hour, you'll master using Python YFinance to extract stock price data and create Japanese candlestick charts in Tableau. Ideal for those looking to enhance their data analysis skills, this free course provides a hands-on, project-based learning experience under expert guidance. Perfect for aspiring data scientists and analysts.