Data Visualization & Dashboarding with R
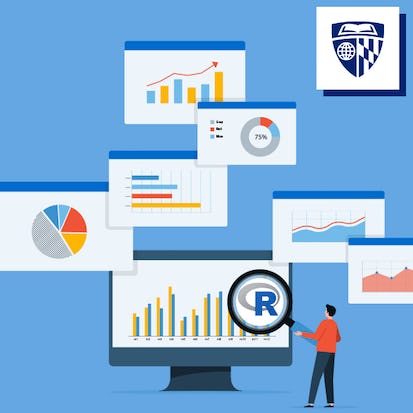
This Specialization is intended for learners seeking to develop the ability to visualize data using R. Through five courses, you will use R to create static and interactive data visualizations and publish them on the web, which will you prepare you to provide insight to many types of audiences.
Monthly Subscription Starting at AED 99 + VAT
- Level Foundation
- Course by Johns Hopkins University
-
Offered by

About
This Specialization is intended for learners seeking to develop the ability to visualize data using R. Through five courses, you will use R to create static and interactive data visualizations and publish them on the web, which will you prepare you to provide insight to many types of audiences.Auto Summary
Unlock the power of data with the "Data Visualization & Dashboarding with R" specialization, designed for aspiring data enthusiasts and professionals in IT and Computer Science. This comprehensive program, offered by Coursera, consists of five in-depth courses that guide you through the essentials of creating both static and interactive data visualizations using R. You'll learn to transform complex data sets into clear, insightful visual representations and publish your work online, making your data accessible and understandable to a wide range of audiences. Whether you're just starting out or looking to refine your skills, this foundational course provides the tools and knowledge you need to excel in the field of data visualization. With flexible subscription options, including a Starter plan, you can begin your journey at your own pace. Join now to enhance your ability to communicate data insights effectively and elevate your proficiency in R.

Collin Paschall