Buy Now Free
- Level Intermediate
- Duration 3 hours
-
Offered by

About
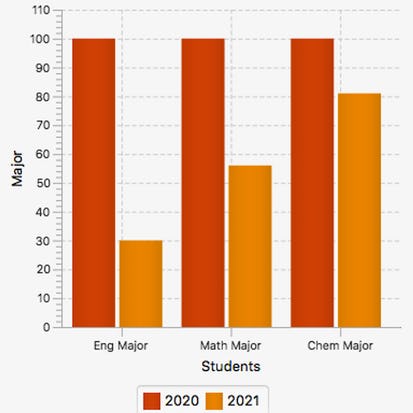
In this project, you will create a graphical user interface with a split pane that contains two panes. The first pane provides text fields to collect data on the number of students enrolled in English major, Mathematics major, and Chemistry major. In the second pane, there is a bar chart with the number of students in each major in the year 2020. When the button in the first pane is clicked, the bar chart will be updated with the number of students in each major in the year 2021.Auto Summary
Enhance your JavaFX skills with this intermediate course on creating graphical user interfaces. Learn to display data using bar charts and split panes. Offered by Coursera, this free 180-minute course is perfect for IT and computer science enthusiasts looking to advance their knowledge.