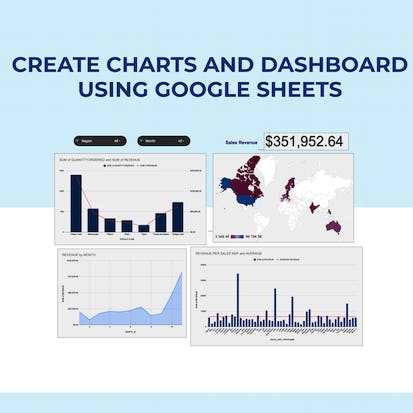
Create Charts and Dashboard using Google Sheets
In this 2-hour long project-based course, you will learn how to create effective charts and a dynamic dashboard to visualize data sets.
Buy Now Free
- Level Beginner
- Duration 3 hours
- Course by Coursera
-
Offered by

About
In this 2-hour long project-based course, you will learn how to create effective charts and a dynamic dashboard to visualize data sets. You will be able to work with vlookups, pivot tables and basic formulas and be able to create dynamic charts, sparklines, and a robust, dynamic dashboard to present the data. By the end of the project you will be able to: - Understand the terminologies of spreadsheets - Work with basic formulas in Google Sheets - Create 8 Basic Charts for visualizing data - Generate Dynamic Charts from a dropdown list - Generate Sparklines to represent data - Build a dashboard and introduce Basic and Advanced Charts - Use Slicers to filter data and create a robust and dynamic dashboard Note: If you don't have a Google account, you will need to create one to be able to complete the content.Modules
Create Charts and Dashboard using Google Sheets
-
 2
Readings
2
Readings
-
 1
Quiz
1
Quiz
-
 1
Plugin
1
Plugin
-
 1
Lab
1
Lab
![]() 1
Labs
1
Labs
- Create Charts and Dashboard using Google Sheets
![]() 2
Readings
2
Readings
- Project-based Course Overview
- How to create a Google Account (if you don't have one)
![]() 1
Quiz
1
Quiz
- Graded Quiz: Final Assignment
Auto Summary
Discover the art of data visualization with our engaging course, "Create Charts and Dashboard using Google Sheets." Designed for those looking to enhance their spreadsheet skills, this 2-hour project-based course will guide you through the creation of compelling charts and dynamic dashboards to effectively present data sets. Led by expert instructors from Coursera, this foundational course covers essential tools and techniques such as vlookups, pivot tables, and basic formulas. You'll learn to craft 8 basic charts, dynamic charts with dropdown lists, and sparklines to vividly represent your data. The course also delves into building robust dashboards, incorporating both basic and advanced charts, and utilizing slicers for data filtering. Ideal for beginners in personal development seeking to boost their proficiency in Google Sheets, this course offers a concise, hands-on learning experience. By the end, you'll have a solid grasp of spreadsheet terminologies and practical skills to create dynamic, data-driven visuals. Join now with a Starter subscription and start transforming your data into insightful visualizations! Note: A Google account is required to complete the course content.

Ishita Sinha