Buy Now Free
- Level Beginner
- Duration 2 hours
-
Offered by

About
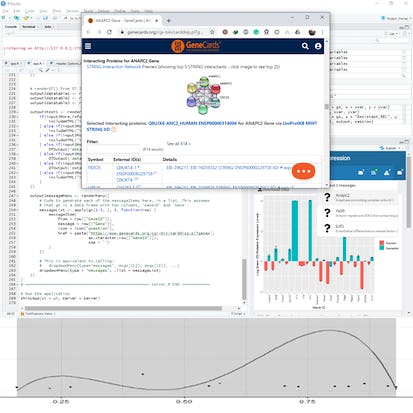
In this project-based course, you will create a Shiny app to plot gene expression data (Real-Time PCR) from a published manuscript. You will build the Shiny app from scratch and handle every component of Shiny. The project covers data processing and collecting feedback from the user to build and finetune the output. In this course, we will be concerned with the optimal use of inputs and outputs. Instead of building a lot of inputs and outputs, we will use a limited number of components and recycle some even seven times for different purposes.Auto Summary
Elevate your skills in data visualization and gene expression analysis with the engaging and practical course, "Using Shiny to Plot Differential Gene Expression." This beginner-friendly, project-based course is designed to guide you through the creation of a Shiny app that visualizes gene expression data, specifically Real-Time PCR data from a published manuscript. Offered by Coursera, this 120-minute course is perfect for those looking to enhance their personal development in the bioinformatics domain. Best of all, it's available for free, making it an accessible and valuable resource for anyone interested in learning how to effectively use Shiny for biological data analysis. Whether you're a student, researcher, or enthusiast, this course provides a solid foundation to kickstart your journey into the fascinating world of gene expression visualization.