


Generative AI for Business Leaders
Advertising with Meta
How Google does Machine Learning


دوراتنا

Harnessing the Power of Data with Power BI
This course forms part of the Microsoft Power BI Analyst Professional Certificate. This Professional Certificate consists of a series of courses that offers a good starting point for a career in data analysis using Microsoft Power BI. In this course, you’ll learn about the role of a data analyst and the main stages involved in the data analysis process with a focus on applying them using Microsoft Power BI.
-
Course by

-
 Self Paced
-
 16 ساعات
-
 الإنجليزية
Using DAX throughout PowerBI to create robust data scenarios
If you don't use Data Analysis Expressions (DAX) Language, you will miss out on 95% of Power BI's potential as a fantastic analytical tool, and the journey to becoming a DAX master starts with the right step. This project-based course, "Using DAX throughout Power BI to create robust data scenarios," is intended for novice data analysts willing to advance their knowledge and skills.
-
Course by
-
Self Paced
-
3 ساعات
-
الإنجليزية
Microsoft Power BI Service - Publishing Reports to the Cloud
✓ Master Power BI Service (Cloud) ✓ Publish Power BI reports to the cloud ✓ Collaborate with colleagues in Power BI Service ✓ Create workspaces, manage permission, and share reports Looking to take your Power BI skills to the next level by publishing reports to the cloud? Look no further than this course on Power BI Service. In this course, you will learn step-by-step how to publish your reports to the cloud and share them with others. You will gain an understanding of how to create a workspace, manage permissions, and share reports with others.
-
Course by
-
Self Paced
-
3 ساعات
-
الإنجليزية

HR Analytics- Build an HR dashboard using Power BI
In this 1 hour long project, you will build an attractive and eye-catching HR dashboard using Power BI. We will begin this guided project by importing data & creating an employee demographics page that gives us the overall demographic outlook of the organization. We will then create pie charts and doughnut charts to visualize gender & racial diversity. In the final tasks, we will create an employee detail page that will provide you with all the important information about any employee with just a click.
-
Course by
-
Self Paced
-
2 ساعات
-
الإنجليزية

From Excel to Power BI
Are you using Excel to manage, analyze, and visualize your data? Would you like to do more? Perhaps you've considered Power BI as an alternative, but have been intimidated by the idea of working in an advanced environment. The fact is, many of the same tools and mechanisms exist across both these Microsoft products. This means Excel users are actually uniquely positioned to transition to data modeling and visualization in Power BI! Using methods that will feel familiar, you can learn to use Power BI to make data-driven business decisions using large volumes of data.
-
Course by
-
Self Paced
-
3 ساعات
-
الإنجليزية

Microsoft PL-300 Exam Preparation and Practice
This course forms part of the Microsoft Power BI Analyst Professional Certificate. This Professional Certificate consists of a series of courses that offer a good starting point for a career in data analysis using Microsoft Power BI. This course will help you prepare for the Microsoft PL-300 exam. In this course, you’ll refresh your knowledge of all the key areas assessed in the Microsoft-certified Exam PL-300: Microsoft Power BI Data Analyst. In addition, you will prepare for the certification exam by taking a mock exam with a similar format and content as in the Microsoft PL-300 exam.
-
Course by
-
Self Paced
-
1 ساعات
-
الإنجليزية
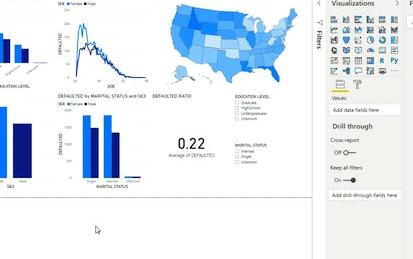
Getting Started with Power BI Desktop
In this 2-hour long project-based course, you will learn the basics of using Power BI Desktop software. We will do this by analyzing data on credit card defaults with Power BI Desktop. Power BI Desktop is a free Business Intelligence application from Microsoft that lets you load, transform, and visualize data. You can create interactive reports and dashboards quite easily, and quickly. We will learn some of the basics of Power BI by importing, transforming, and visualizing the data.
-
Course by
-
Self Paced
-
2 ساعات
-
الإنجليزية

Data Modeling in Power BI
This course forms part of the Microsoft Power BI Analyst Professional Certificate. This Professional Certificate consists of a series of courses that offers a good starting point for a career in data analysis using Microsoft Power BI. In this course, you'll learn how to use Power BI to create and maintain relationships in a data model and form a model using multiple Schemas. You'll explore the basics of DAX, Power BI's expression language, and add calculations to your model to create elements and analysis in Power BI.
-
Course by
-
Self Paced
-
الإنجليزية
Data Visualization in Power BI: Create Your First Dashboard
Connect Power BI to different sources to create interactive dashboards in Power BI. For example, a data analyst can build a dashboard that is interactive and can track key business metrics to help business stakeholders make actionable business decisions.
-
Course by
-
Self Paced
-
2 ساعات
-
الإنجليزية
Prepare, Clean, Transform, and Load Data using Power BI
Usually, tidy data is a mirage in a real-world setting. Additionally, before quality analysis can be done, data need to be in a proper format. This project-based course, "Prepare, Clean, Transform, and Load Data using Power BI" is for beginner and intermediate Power BI users willing to advance their knowledge and skills.
-
Course by
-
Self Paced
-
3 ساعات
-
الإنجليزية
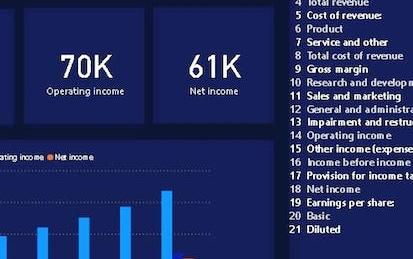
Build an Income Statement Dashboard in Power BI
In this 1.5 hours long project, we will be creating an income statement dashboard filled with relevant charts and data. Power BI dashboards are an amazing way to visualize data and make them interactive. We will begin this guided project by importing the data and transforming it in the Power Query editor. We will then visualize the Income Statement using a table, visualize total revenue, operating income and net income using cards and in the final task visualize the year on year growth using clustered column charts.
-
Course by
-
Self Paced
-
2 ساعات
-
الإنجليزية

Python with Power BI: Analyzing Financial Data
In this project, we will create a Financial dashboard for assets like stock and crypto. The dashboard will be dynamic in nature meaning you will be able to get important information and graphs about any stock just by replacing the ticker symbol without ever leaving Power BI. The project begins with you importing real-time financial data from Yahoo Finance using Python libraries. You will harness the power of Python libraries and custom visuals in Power BI to visualize the data, creating approximately 10 different charts and graphs to analyze price and volume movement.
-
Course by
-
Self Paced
-
3 ساعات
-
الإنجليزية
Data-Driven Decisions with Power BI
New Power BI users will begin the course by gaining a conceptual understanding of the Power BI desktop application and the Power BI service. Learners will explore the Power BI interface while learning how to manage pages and understand the basics of visualizations. Learners can download a course dataset and engage in numerous hands-on experiences to discover how to import, connect, clean, transform, and model their own data in the Power BI desktop application.
-
Course by
-
Self Paced
-
14 ساعات
-
الإنجليزية

Analyzing and Visualizing Data with Power BI
Step up your analytics game and learn one of the most in-demand job skills in the United States. Content rebooted in September 2023!
-
Course by

-
Self Paced
-
6
-
الإنجليزية

Data Analysis and Visualization
By the end of this course, learners are provided a high-level overview of data analysis and visualization tools, and are prepared to discuss best practices and develop an ensuing action plan that addresses key discoveries. It begins with common hurdles that obstruct adoption of a data-driven culture before introducing data analysis tools (R software, Minitab, MATLAB, and Python). Deeper examination is spent on statistical process control (SPC), which is a method for studying variation over time.
-
Course by
-
Self Paced
-
11 ساعات
-
الإنجليزية
Excel Skills for Data Analytics and Visualization
As data becomes the modern currency, so the ability to quickly and accurately analyse data has become of paramount importance. Therefore, data analytics and visualization are two of the most sought after skills for high paying jobs with strong future growth prospects. According to an IBM report, the Excel tools for data analytics and visualization are among the top 10 competencies projected to show double-digit growth in their demand.
-
Course by
-
Self Paced
-
الإنجليزية
Business Analytics
Our world has become increasingly digital, and business leaders need to make sense of the enormous amount of available data today. In order to make key strategic business decisions and leverage data as a competitive advantage, it is critical to understand how to draw key insights from this data.
-
Course by
-
الإنجليزية

Data Analysis and Visualization with Power BI
This course forms part of the Microsoft Power BI Analyst Professional Certificate. This Professional Certificate consists of a series of courses that offers a good starting point for a career in data analysis using Microsoft Power BI. In this course, you will learn report design and formatting in Power BI, which offers extraordinary visuals for building reports and dashboards. Additionally, you will learn how to use report navigation to tell a compelling, data-driven story in Power BI.
-
Course by
-
Self Paced
-
30 ساعات
-
الإنجليزية

Creative Designing in Power BI
This course forms part of the Microsoft Power BI Analyst Professional Certificate. This Professional Certificate consists of a series of courses that offers a good starting point for a career in data analysis using Microsoft Power BI. In this course, you will learn how to creatively design dashboards, reports and charts that are easier for the audience to use. You will learn how to create cohesive business intelligence reports and dashboards, as well as what common problems to avoid.
-
Course by
-
20 ساعات
-
الإنجليزية

Microsoft Power BI Data Analyst
Learners who complete this program will receive a 50% discount voucher to take the PL-300 Certification Exam. Business Intelligence analysts are highly sought after as more organizations rely on data-driven decision-making.
-
Course by
-
Self Paced
-
الإنجليزية

Microsoft Power BI Desktop - The Practical Bootcamp
✓ Master Power BI Desktop from end-to-end ✓ Create impressive reports with Power BI ✓ Work professionally with Power BI Microsoft Power BI Desktop is the perfect tool for creating impressive reports, and this course will teach you everything you need to know to become an advanced report creator.
-
Course by
-
Self Paced
-
9 ساعات
-
الإنجليزية
Power BI for Beginners Introduction to DAX Language
Use the DAX Language to create measures and calculations to faciliate creating visualizations and reports in Power BI
-
Course by
-
Self Paced
-
4 ساعات
-
الإنجليزية

Use Power Bi for Financial Data Analysis
In this project, learners will have a guided look through Power Bi dynamic reports and visualizations for financial data analysis. As you view, load, and transform your data in Power Bi, you will learn which steps are key to making an effective financial report dashboard and how to connect your report for dynamic visualizations. Data reporting and visualization is the most critical step in a financial, business, or data analyst’s functions. The data is only as effective if it can be communicated effectively to key stakeholders in the organization. Effective communication of data starts here.
-
Course by
-
Self Paced
-
3 ساعات
-
الإنجليزية

Microsoft Azure Data Fundamentals DP-900 Exam Prep
This Specialization is intended for IT professionals who want to learn the fundamentals of database concepts in a cloud environment, get basic skilling in cloud data services, and build their foundational knowledge of cloud data services within Microsoft Azure. Through five courses, you will prepare to take the DP-900 exam. This program will prepare you to take up Data Engineer, Data Analyst, and Database Administrator roles. You will explore the roles, tasks, and responsibilities in the world of data.
-
Course by
-
Self Paced
-
الإنجليزية

Extract, Transform and Load Data in Power BI
This course forms part of the Microsoft Power BI Analyst Professional Certificate. This Professional Certificate consists of a series of courses that offers a good starting point for a career in data analysis using Microsoft Power BI. In this course, you will learn the process of Extract, Transform and Load or ETL. You will identify how to collect data from and configure multiple sources in Power BI and prepare and clean data using Power Query. You’ll also have the opportunity to inspect and analyze ingested data to ensure data integrity.
-
Course by
-
Self Paced
-
20 ساعات
-
الإنجليزية