


Generative AI for Business Leaders
Advertising with Meta
How Google does Machine Learning


Our Courses

Survey Data Collection and Analytics Project (Capstone)
The Capstone Project offers qualified learners to the opportunity to apply their knowledge by analyzing and comparing multiple data sources on the same topic. Students will develop a research question, access and analyze relevant data, and critically examine the quality of each data source.
-
Course by

-
 Self Paced
-
 14 hours
-
 English
Predict Career Longevity for NBA Rookies using Scikit-learn
By the end of this project, you will be able to apply data analysis to predict career longevity for NBA Rookie using python.
-
Course by
-
Self Paced
-
3 hours
-
English

Data Visualization with R
In this course, you will learn the Grammar of Graphics, a system for describing and building graphs, and how the ggplot2 data visualization package for R applies this concept to basic bar charts, histograms, pie charts, scatter plots, line plots, and box plots. You will also learn how to further customize your charts and plots using themes and other techniques. You will then learn how to use another data visualization package for R called Leaflet to create map plots, a unique way to plot data based on geolocation data.
-
Course by
-
Self Paced
-
12 hours
-
English

Harnessing the Power of Data with Power BI
This course forms part of the Microsoft Power BI Analyst Professional Certificate. This Professional Certificate consists of a series of courses that offers a good starting point for a career in data analysis using Microsoft Power BI. In this course, you’ll learn about the role of a data analyst and the main stages involved in the data analysis process with a focus on applying them using Microsoft Power BI.
-
Course by
-
Self Paced
-
16 hours
-
English

Mathematical Biostatistics Boot Camp 2
Learn fundamental concepts in data analysis and statistical inference, focusing on one and two independent samples.
-
Course by
-
Self Paced
-
12 hours
-
English
Go Beyond the Numbers: Translate Data into Insights
This is the third of seven courses in the Google Advanced Data Analytics Certificate. In this course, you’ll learn how to find the story within data and tell that story in a compelling way. You'll discover how data professionals use storytelling to better understand their data and communicate key insights to teammates and stakeholders. You'll also practice exploratory data analysis and learn how to create effective data visualizations.
-
Course by
-
Self Paced
-
33 hours
-
English

Hierarchical relational data analysis using python
By the end of this project you will learn how to analyze Hierarchical Data.
-
Course by
-
Self Paced
-
2 hours
-
English
Google Sheets - Advanced Topics
This course builds on some of the concepts covered in the earlier Google Sheets course. In this course, you will learn how to apply and customize themes In Google Sheets, and explore conditional formatting options. You will learn about some of Google Sheets’ advanced formulas and functions. You will explore how to create formulas using functions, and you will also learn how to reference and validate your data in a Google Sheet. Spreadsheets can hold millions of numbers, formulas, and text. Making sense of all of that data can be difficult without a summary or visualization.
-
Course by
-
Self Paced
-
3 hours
-
English
SQL for Data Science Capstone Project
Data science is a dynamic and growing career field that demands knowledge and skills-based in SQL to be successful. This course is designed to provide you with a solid foundation in applying SQL skills to analyze data and solve real business problems. Whether you have successfully completed the other courses in the Learn SQL Basics for Data Science Specialization or are taking just this course, this project is your chance to apply the knowledge and skills you have acquired to practice important SQL querying and solve problems with data.
-
Course by
-
Self Paced
-
35 hours
-
English

Big Data Analysis with Scala and Spark (Scala 2 version)
Manipulating big data distributed over a cluster using functional concepts is rampant in industry, and is arguably one of the first widespread industrial uses of functional ideas. This is evidenced by the popularity of MapReduce and Hadoop, and most recently Apache Spark, a fast, in-memory distributed collections framework written in Scala. In this course, we'll see how the data parallel paradigm can be extended to the distributed case, using Spark throughout.
-
Course by
-
Self Paced
-
28 hours
-
English
Empathy, Data, and Risk
Risk Management and Innovation develops your ability to conduct empathy-driven and data-driven analysis in the domain of risk management. This course introduces empathy as a professional competency. It explains the psychological processes that inhibit empathy-building and the processes that determine how organizational stakeholders respond to risk. The course guides you through techniques to gather risk information by understanding a stakeholder’s thoughts, feelings, and goals. These techniques include interviewing, brainstorming, and empathy mapping.
-
Course by
-
Self Paced
-
13 hours
-
English
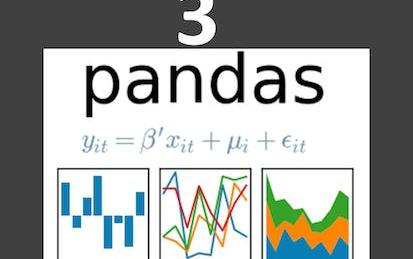
Mastering Data Analysis with Pandas: Learning Path Part 4
In this structured series of hands-on guided projects, we will master the fundamentals of data analysis and manipulation with Pandas and Python. Pandas is a super powerful, fast, flexible and easy to use open-source data analysis and manipulation tool. This guided project is the fourth of a series of multiple guided projects (learning path) that is designed for anyone who wants to master data analysis with pandas. Note: This course works best for learners who are based in the North America region. We’re currently working on providing the same experience in other regions.
-
Course by
-
Self Paced
-
3 hours
-
English

Machine Learning with PySpark: Data Analysis using SQL
This Guided Project is for beginning Python Developers.
-
Course by
-
Self Paced
-
3 hours
-
English
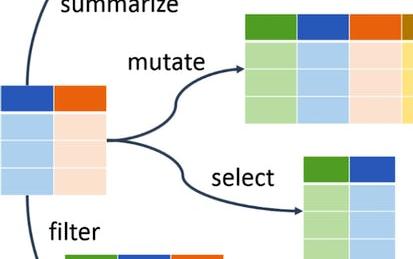
Build Data Analysis and Transformation Skills in R using DPLYR
Congratulations you've made it to Part 2 of the DPLYR series! In a moment you will be taken to Rhyme where a Virtual Machine with R, R Studio and DPLYR awaits.
-
Course by
-
Self Paced
-
2 hours
-
English

Introduction to Data Analytics on Google Cloud
In this beginner-level course, you will learn about the Data Analytics workflow on Google Cloud and the tools you can use to explore, analyze, and visualize data and share your findings with stakeholders. Using a case study along with hands-on labs, lectures, and quizzes/demos, the course will demonstrate how to go from raw datasets to clean data to impactful visualizations and dashboards. Whether you already work with data and want to learn how to be successful on Google Cloud, or you’re looking to progress in your career, this course will help you get started.
-
Course by
-
Self Paced
-
4 hours
-
English
Build and deploy a stroke prediction model using R
In this project, you’ll help a leading healthcare organization build a model to predict the likelihood of a patient suffering a stroke. The model could help improve a patient’s outcomes.
-
Course by
-
Self Paced
-
3 hours
-
English
Advanced Business Analytics Capstone
The analytics process is a collection of interrelated activities that lead to better decisions and to a higher business performance. The capstone of this specialization is designed with the goal of allowing you to experience this process. The capstone project will take you from data to analysis and models, and ultimately to presentation of insights. In this capstone project, you will analyze the data on financial loans to help with the investment decisions of an investment company.
-
Course by
-
Self Paced
-
20 hours
-
English
R Tutorial
This comprehensive course is your one-stop-shop for learning the R programming language, a popular tool for data analysis, visualization, and statistical computing. Our course covers all the fundamentals of R, including data types, control structures, functions, and packages. Throughout the course, you'll explore how to import, manipulate, and visualize data using R. Plus, you'll learn how to perform statistical analyses and create custom graphics. By the end of this course, you'll have a solid foundation in R programming and be able to use it for a wide range of data analysis tasks.
-
Course by
-
Self Paced
-
12 hours
-
English
Probability & Statistics for Machine Learning & Data Science
Newly updated for 2024! Mathematics for Machine Learning and Data Science is a foundational online program created by DeepLearning.AI and taught by Luis Serrano. In machine learning, you apply math concepts through programming. And so, in this specialization, you’ll apply the math concepts you learn using Python programming in hands-on lab exercises.
-
Course by
-
Self Paced
-
29 hours
-
English
Avoiding Data Science Pitfalls
In this 2-hour long project-based course, you will learn some important statistical concepts with examples & visuals, concepts that are most commonly mistaken in data analysis and how to ensure you don't fall for them.
-
Course by
-
Self Paced
-
3 hours
-
English
ESG Data & Accountability
In this course, we’ll introduce students with basic knowledge of traditional financial products to data-driven resources they can use to complement their fundamental analysis.
-
Course by
-
Self Paced
-
20 hours
-
English

Advanced R Programming
This course covers advanced topics in R programming that are necessary for developing powerful, robust, and reusable data science tools. Topics covered include functional programming in R, robust error handling, object oriented programming, profiling and benchmarking, debugging, and proper design of functions. Upon completing this course you will be able to identify and abstract common data analysis tasks and to encapsulate them in user-facing functions.
-
Course by
-
Self Paced
-
18 hours
-
English

Using Basic Formulas and Functions in Microsoft Excel
Have you started using spreadsheets like Excel and want to learn how to write formulas and functions to perform simple data analysis? In this project, you will learn about the general format for writing formulas and functions in Excel to perform analysis on the sales data from a sample company. In this analysis, you will calculate total sums of profits, you will learn how to use functions to analyze the popularity of the items sold and you will also learn how to calculate averages and percentages of monthly profits.
-
Course by
-
Self Paced
-
3 hours
-
English
Data Manipulation at Scale: Systems and Algorithms
Data analysis has replaced data acquisition as the bottleneck to evidence-based decision making --- we are drowning in it. Extracting knowledge from large, heterogeneous, and noisy datasets requires not only powerful computing resources, but the programming abstractions to use them effectively.
-
Course by
-
Self Paced
-
20 hours
-
English
Visualizing & Communicating Results in Python with Jupyter
Code and run your first Python program in minutes without installing anything! This course is designed for learners with limited coding experience, providing a foundation for presenting data using visualization tools in Jupyter Notebook. This course helps learners describe and make inferences from data, and better communicate and present data. The modules in this course will cover a wide range of visualizations which allow you to illustrate and compare the composition of the dataset, determine the distribution of the dataset, and visualize complex data such as geographically-based data.
-
Course by
-
Self Paced
-
11 hours
-
English