


Generative AI for Business Leaders
Advertising with Meta
How Google does Machine Learning


Our Courses

Predictive Modeling and Analytics
Welcome to the second course in the Data Analytics for Business specialization! This course will introduce you to some of the most widely used predictive modeling techniques and their core principles. By taking this course, you will form a solid foundation of predictive analytics, which refers to tools and techniques for building statistical or machine learning models to make predictions based on data. You will learn how to carry out exploratory data analysis to gain insights and prepare data for predictive modeling, an essential skill valued in the business.
-
Course by

-
 11 hours
-
 English
Introduction to Probability and Data with R
This course introduces you to sampling and exploring data, as well as basic probability theory and Bayes' rule. You will examine various types of sampling methods, and discuss how such methods can impact the scope of inference. A variety of exploratory data analysis techniques will be covered, including numeric summary statistics and basic data visualization. You will be guided through installing and using R and RStudio (free statistical software), and will use this software for lab exercises and a final project.
-
Course by
-
 Self Paced
-
14 hours
-
English

Meaningful Marketing Insights
With marketers are poised to be the largest users of data within the organization, there is a need to make sense of the variety of consumer data that the organization collects. Surveys, transaction histories and billing records can all provide insight into consumers’ future behavior, provided that they are interpreted correctly. In Introduction to Marketing Analytics, we introduce the tools that learners will need to convert raw data into marketing insights.
-
Course by
-
Self Paced
-
10 hours
-
English

Predictive Modeling and Machine Learning with MATLAB
In this course, you will build on the skills learned in Exploratory Data Analysis with MATLAB and Data Processing and Feature Engineering with MATLAB to increase your ability to harness the power of MATLAB to analyze data relevant to the work you do. These skills are valuable for those who have domain knowledge and some exposure to computational tools, but no programming background.
-
Course by
-
Self Paced
-
22 hours
-
English
Launching into Machine Learning
The course begins with a discussion about data: how to improve data quality and perform exploratory data analysis. We describe Vertex AI AutoML and how to build, train, and deploy an ML model without writing a single line of code. You will understand the benefits of Big Query ML. We then discuss how to optimize a machine learning (ML) model and how generalization and sampling can help assess the quality of ML models for custom training.
-
Course by
-
Self Paced
-
14 hours
-
English
Six Sigma Advanced Define and Measure Phases
This course is for you if you are looking to dive deeper into Six Sigma or strengthen and expand your knowledge of the basic components of green belt level of Six Sigma and Lean. Six Sigma skills are widely sought by employers both nationally and internationally. These skills have been proven to help improve business processes and performance.
-
Course by
-
Self Paced
-
15 hours
-
English

Data Processing and Feature Engineering with MATLAB
In this course, you will build on the skills learned in Exploratory Data Analysis with MATLAB to lay the foundation required for predictive modeling. This intermediate-level course is useful to anyone who needs to combine data from multiple sources or times and has an interest in modeling. These skills are valuable for those who have domain knowledge and some exposure to computational tools, but no programming background.
-
Course by
-
Self Paced
-
20 hours
-
English

Managing Data Analysis
This one-week course describes the process of analyzing data and how to manage that process. We describe the iterative nature of data analysis and the role of stating a sharp question, exploratory data analysis, inference, formal statistical modeling, interpretation, and communication. In addition, we will describe how to direct analytic activities within a team and to drive the data analysis process towards coherent and useful results. This is a focused course designed to rapidly get you up to speed on the process of data analysis and how it can be managed.
-
Course by
-
Self Paced
-
9 hours
-
English

Basic Statistics in Python (ANOVA)
In this 1-hour long project-based course, you will learn how to set up a Google Colab notebook, source data from the internet, load data into Python, merge two datasets, clean data, perform exploratory data analysis, carry out ANOVA and create boxplots.
-
Course by
-
Self Paced
-
4 hours
-
English

Unsupervised Machine Learning
This course introduces you to one of the main types of Machine Learning: Unsupervised Learning. You will learn how to find insights from data sets that do not have a target or labeled variable. You will learn several clustering and dimension reduction algorithms for unsupervised learning as well as how to select the algorithm that best suits your data.
-
Course by
-
Self Paced
-
23 hours
-
English

Marketing Analytics Capstone Project
This capstone project will give you an opportunity to apply what we have covered in the Foundations of Marketing Analytics specialization. By the end of this capstone project, you will have conducted exploratory data analysis, examined pairwise relationships among different variables, and developed and tested a predictive model to solve a marketing analytics problem. It is highly recommended that you complete all courses within the Foundations of Marketing Analytics specialization before starting the capstone course.
-
Course by
-
Self Paced
-
11 hours
-
English

IBM Data Analyst Capstone Project
By completing this final capstone project you will apply various Data Analytics skills and techniques that you have learned as part of the previous courses in the IBM Data Analyst Professional Certificate. You will assume the role of an Associate Data Analyst who has recently joined the organization and be presented with a business challenge that requires data analysis to be performed on real-world datasets.
-
Course by
-
Self Paced
-
21 hours
-
English

Applied Data Science Capstone
This is the final course in the IBM Data Science Professional Certificate as well as the Applied Data Science with Python Specialization. This capstone project course will give you the chance to practice the work that data scientists do in real life when working with datasets.
-
Course by
-
Self Paced
-
13 hours
-
English
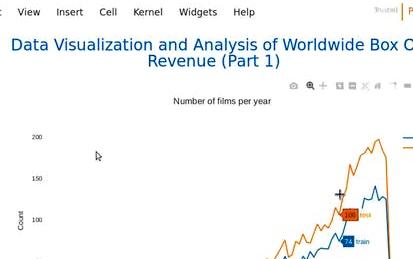
Analyze Box Office Data with Seaborn and Python
Welcome to this project-based course on Analyzing Box Office Data with Seaborn and Python. In this course, you will be working with the The Movie Database (TMDB) Box Office Prediction data set. The motion picture industry is raking in more revenue than ever with its expansive growth the world over. Can we build models to accurately predict movie revenue? Could the results from these models be used to further increase revenue? We try to answer these questions by way of exploratory data analysis (EDA) in this project and the next.
-
Course by
-
Self Paced
-
3 hours
-
English
Conducting Exploratory Data Analysis
Conduct exploratory data analysis with a systematic approach to investigate different aspects of your data: comparisons, relationships, compositions, and distributions. This guided project gives you a framework so you can conduct your own exploratory data analysis and make your work more professional and organized. The language is Python and the libraries used are seaborn, pandas, and matplotlib.
-
Course by
-
Self Paced
-
3 hours
-
English

Probability & Statistics for Machine Learning & Data Science
Newly updated for 2024! Mathematics for Machine Learning and Data Science is a foundational online program created by DeepLearning.AI and taught by Luis Serrano. In machine learning, you apply math concepts through programming. And so, in this specialization, you’ll apply the math concepts you learn using Python programming in hands-on lab exercises.
-
Course by
-
Self Paced
-
29 hours
-
English
Go Beyond the Numbers: Translate Data into Insights
This is the third of seven courses in the Google Advanced Data Analytics Certificate. In this course, you’ll learn how to find the story within data and tell that story in a compelling way. You'll discover how data professionals use storytelling to better understand their data and communicate key insights to teammates and stakeholders. You'll also practice exploratory data analysis and learn how to create effective data visualizations.
-
Course by
-
Self Paced
-
33 hours
-
English
Exploratory Data Analysis for the Public Sector with ggplot
Learn about the core pillars of the public sector and the core functions of public administration through statistical Exploratory Data Analysis (EDA). Learn analytical and technical skills using the R programming language to explore, visualize, and present data, with a focus on equity and the administrative functions of planning and reporting. Technical skills in this course will focus on the ggplot2 library of the tidyverse, and include developing bar, line, and scatter charts, generating trend lines, and understanding histograms, kernel density estimations, violin plots, and ridgeplots.
-
Course by
-
Self Paced
-
18 hours
-
English

Deep Learning and Reinforcement Learning
This course introduces you to two of the most sought-after disciplines in Machine Learning: Deep Learning and Reinforcement Learning. Deep Learning is a subset of Machine Learning that has applications in both Supervised and Unsupervised Learning, and is frequently used to power most of the AI applications that we use on a daily basis. First you will learn about the theory behind Neural Networks, which are the basis of Deep Learning, as well as several modern architectures of Deep Learning.
-
Course by
-
32 hours
-
English
Vertex AI: Qwik Start
This is a self-paced lab that takes place in the Google Cloud console. In this lab, you will use BigQuery for data processing and exploratory data analysis, and the Vertex AI platform to train and deploy a custom TensorFlow Regressor model to predict customer lifetime value (CLV). The goal of the lab is to introduce to Vertex AI through a high value real world use case - predictive CLV. Starting with a local BigQuery and TensorFlow workflow, you will progress toward training and deploying your model in the cloud with Vertex AI.
-
Course by
-
Self Paced
-
2 hours
-
English

Data Science with R - Capstone Project
In this capstone course, you will apply various data science skills and techniques that you have learned as part of the previous courses in the IBM Data Science with R Specialization or IBM Data Analytics with Excel and R Professional Certificate. For this project, you will assume the role of a Data Scientist who has recently joined an organization and be presented with a challenge that requires data collection, analysis, basic hypothesis testing, visualization, and modeling to be performed on real-world datasets.
-
Course by
-
Self Paced
-
26 hours
-
English

Create Machine Learning Models in Microsoft Azure
Machine learning is the foundation for predictive modeling and artificial intelligence. If you want to learn about both the underlying concepts and how to get into building models with the most common machine learning tools this path is for you. In this course, you will learn the core principles of machine learning and how to use common tools and frameworks to train, evaluate, and use machine learning models. This course is designed to prepare you for roles that include planning and creating a suitable working environment for data science workloads on Azure.
-
Course by
-
Self Paced
-
13 hours
-
English

Analyze Data in a Model Car Database with MySQL Workbench
In this project, you’ll perform exploratory data analysis for Mint Classics Company, a retailer of model cars. The company is looking to close one of its storage facilities. Your objective is to recommend inventory reduction strategies that won’t negatively impact customer service. Using MySQL Workbench, you’ll familiarize yourself with the sample database, run SQL queries to identify factors affecting storage space and propose inventory reduction approaches.
-
Course by
-
Self Paced
-
3 hours
-
English

Mining Quality Prediction Using Machine & Deep Learning
In this 1.5-hour long project-based course, you will be able to: - Understand the theory and intuition behind Simple and Multiple Linear Regression. - Import Key python libraries, datasets and perform data visualization - Perform exploratory data analysis and standardize the training and testing data. - Train and Evaluate different regression models using Sci-kit Learn library. - Build and train an Artificial Neural Network to perform regression. - Understand the difference between various regression models KPIs such as MSE, RMSE, MAE, R2, and adjusted R2. - Assess the performance of regressio
-
Course by
-
Self Paced
-
2 hours
-
English

Fundamentals of Machine Learning for Supply Chain
This course will teach you how to leverage the power of Python to understand complicated supply chain datasets. Even if you are not familiar with supply chain fundamentals, the rich data sets that we will use as a canvas will help orient you with several Pythonic tools and best practices for exploratory data analysis (EDA). As such, though all datasets are geared towards supply chain minded professionals, the lessons are easily generalizable to other use cases.
-
Course by
-
Self Paced
-
13 hours
-
English