


Generative AI for Business Leaders
Advertising with Meta
How Google does Machine Learning


Our Courses
Splunk Search Expert
By completing Search Expert 101, 102 & 103, you will be able to write efficient searches, perform correlations, create visualizations, and leverage subsearches and lookups. This course will also show you how to get started using your machine data to provide actionable reports and dashboards for your organization.
-
Course by

-
 Self Paced
-
 English

Data Science at Scale
Learn scalable data management, evaluate big data technologies, and design effective visualizations. This Specialization covers intermediate topics in data science. You will gain hands-on experience with scalable SQL and NoSQL data management solutions, data mining algorithms, and practical statistical and machine learning concepts. You will also learn to visualize data and communicate results, and you’ll explore legal and ethical issues that arise in working with big data.
-
Course by
-
Self Paced
-
English

Data Analysis and Visualization Foundations
Deriving insights from data and communicating findings has become an increasingly important part of virtually every profession. This Specialization prepares you for this data-driven transformation by teaching you the core principles of data analysis and visualization and by giving you the tools and hands-on practice to communicate the results of your data discoveries effectively. You will be introduced to the modern data ecosystem. You will learn the skills required to successfully start data analysis tasks by becoming familiar with spreadsheets like Excel.
-
Course by
-
Self Paced
-
English
From Data to Insights with Google Cloud
Want to know how to query and process petabytes of data in seconds? Curious about data analysis that scales automatically as your data grows? Welcome to the Data Insights course! This four-course accelerated online specialization teaches course participants how to derive insights through data analysis and visualization using the Google Cloud Platform. The courses feature interactive scenarios and hands-on labs where participants explore, mine, load, visualize, and extract insights from diverse Google BigQuery datasets.
-
Course by
-
Self Paced
-
English

Data Analytics in the Public Sector with R
Every government entity collects and stores millions of data points to perform administrative and legislative duties, allocate resources, and make decisions. Professionals in the public sector need the necessary skills to accurately interpret and inform administrators and policymakers about the meaning behind these data. This Specialization will equip you with fundamental technical skills using the R programming language to gather, manipulate, analyze, visualize, and interpret data to inform public policy and public administrative functions.
-
Course by
-
Self Paced
-
English

Social Determinants of Health: Health Care Systems
This third of five courses explores topics related to the social determinants of health and health care systems. This course will also focus on the relationship between the social determinants of health, mental health, substance abuse, and trauma. The topics of this course include: 1. Health Literacy 2. Mental Health & Substance Abuse 3. Violence, Conflict, and Trauma 4. Ethical Considerations for Health Systems and Data 5. Data Applications: Correlation Analysis and Heat Map Visualization
-
Course by
-
Self Paced
-
 23 hours
-
English

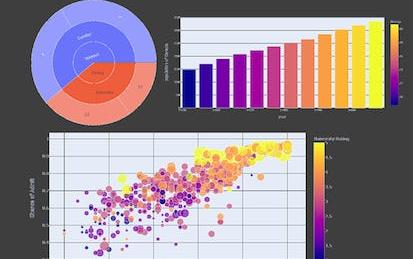
Business Intelligence and Competitive Analysis
American Airlines (AAL), one of the world’s largest airline group and a SP500 company, is in trouble. With the growth rate of its stock price ranked at the bottom of all major US airlines, AAL needs to find out its key problems, the root causes, and how to turn the company and its stock price around. Addressing the challenge faced by AAL may well be a large-scale management consulting project.
-
Course by
-
Self Paced
-
11 hours
-
English

Creative Designing in Power BI
This course forms part of the Microsoft Power BI Analyst Professional Certificate. This Professional Certificate consists of a series of courses that offers a good starting point for a career in data analysis using Microsoft Power BI. In this course, you will learn how to creatively design dashboards, reports and charts that are easier for the audience to use. You will learn how to create cohesive business intelligence reports and dashboards, as well as what common problems to avoid.
-
Course by
-
20 hours
-
English

Applied Data Science with R
This Specialization is intended for anyone with a passion for learning who is seeking to develop the job-ready skills, tools, and portfolio to have a competitive edge in the job market as an entry-level data scientist. Through these five online courses, you will develop the skills you need to bring together often disparate and disconnected data sources and use the R programming language to transform data into insights that help you and your stakeholders make more informed decisions. By the end of this Specialization, you will be able to perform basic R programming tasks to complete the data
-
Course by
-
Self Paced
-
English
Data Understanding and Visualization
The "Data Understanding and Visualization" course provides students with essential statistical concepts to comprehend and analyze datasets effectively. Participants will learn about central tendency, variation, location, correlation, and other fundamental statistical measures. Additionally, the course introduces data visualization techniques using Pandas, Matplotlib, and Seaborn packages, enabling students to present data visually with appropriate plots for accurate and efficient communication. Learning Objectives: 1.
-
Course by
-
25 hours
-
English

Applied Data Science with Python
The 5 courses in this University of Michigan specialization introduce learners to data science through the python programming language.
-
Course by
-
Self Paced
-
English

Information Visualization
This specialization provides learners with the necessary knowledge and practical skills to develop a strong foundation in information visualization and to design and develop advanced applications for visual data analysis…
-
Course by
-
Self Paced
-
English

Use Tableau for Your Data Science Workflow
This specialization covers the foundations of visualization in the context of the data science workflow. Through the application of interactive visual analytics, students will learn how to extract structure from historical data and present key points through graphical storytelling. Additional topics include data manipulation, visualization foundations, audience identification, ethical considerations, dashboard creation, and report generation. Demonstrations of the basic visualization techniques used in Tableau will be included with a hands-on project.
-
Course by
-
Self Paced
-
English

Data Analysis and Visualization with Power BI
This course forms part of the Microsoft Power BI Analyst Professional Certificate. This Professional Certificate consists of a series of courses that offers a good starting point for a career in data analysis using Microsoft Power BI. In this course, you will learn report design and formatting in Power BI, which offers extraordinary visuals for building reports and dashboards. Additionally, you will learn how to use report navigation to tell a compelling, data-driven story in Power BI.
-
Course by
-
Self Paced
-
30 hours
-
English

Mastering Software Development in R
R is a programming language and a free software environment for statistical computing and graphics, widely used by data analysts, data scientists and statisticians. This Specialization covers R software development for building data science tools.
-
Course by
-
Self Paced
-
English

Analytics for Decision Making
The field of analytics is typically built on four pillars: Descriptive Analytics, Predictive Analytics, Causal Analytics, and Prescriptive Analytics. Descriptive analytics (e.g., visualization, BI) deal with the exploration of data for patterns, predictive analytics (e.g., data mining, time-series forecasting) identifies what can happen next, causal modeling establishes causation, and prescriptive analytics help with formulating decisions. This specialization focuses on the Prescriptive Analytics (the final pillar).
-
Course by
-
English

IBM Data Science
Prepare for a career in the high-growth field of data science. In this program, you’ll develop the skills, tools, and portfolio to have a competitive edge in the job market as an entry-level data scientist in as little as 4 months. No prior knowledge of computer science or programming languages is required. Data science involves gathering, cleaning, organizing, and analyzing data with the goal of extracting helpful insights and predicting expected outcomes.
-
Course by
-
Self Paced
-
English

Data Science with R - Capstone Project
In this capstone course, you will apply various data science skills and techniques that you have learned as part of the previous courses in the IBM Data Science with R Specialization or IBM Data Analytics with Excel and R Professional Certificate. For this project, you will assume the role of a Data Scientist who has recently joined an organization and be presented with a challenge that requires data collection, analysis, basic hypothesis testing, visualization, and modeling to be performed on real-world datasets.
-
Course by
-
Self Paced
-
26 hours
-
English

Excel to MySQL: Analytic Techniques for Business
Formulate data questions, explore and visualize large datasets, and inform strategic decisions. In this Specialization, you’ll learn to frame business challenges as data questions. You’ll use powerful tools and methods such as Excel, Tableau, and MySQL to analyze data, create forecasts and models, design visualizations, and communicate your insights.
-
Course by
-
Self Paced
-
English
Data Science
Ask the right questions, manipulate data sets, and create visualizations to communicate results. This Specialization covers the concepts and tools you'll need throughout the entire data science pipeline, from asking the right kinds of questions to making inferences and publishing results. In the final Capstone Project, you’ll apply the skills learned by building a data product using real-world data. At completion, students will have a portfolio demonstrating their mastery of the material.
-
Course by
-
Self Paced
-
English
Creating Business Value with Data and Looker
This series of courses introduces data in the cloud and Looker to someone who would like to become a Looker Developer. It includes the background on how data is managed in the cloud and how it can be used to create value for an organization. You will then learn the skills you need as a Looker Developer to use the Looker Modeling Language (LookML) to empower your organization to conduct self-serve data exploration, analysis and visualization.
-
Course by
-
Self Paced
-
English
Crash Course on Interactive Data Visualization with Plotly
In this hands-on project, we will understand the fundamentals of interactive data visualization using Plolty Express. Plotly Express is a powerful Python package that empowers anyone to create, manipulate and render graphical figures with very few lines of code. Plotly Express is the recommended entry-point into the plotly package. We will leverage Plotly Express to generate interactive single Line plots, multiple line plots, histograms, pie charts, scatterplots, bubble charts, and bar charts. Note: This course works best for learners who are based in the North America region.
-
Course by
-
Self Paced
-
3 hours
-
English

Value Chain Analysis and Visualization in Miro
By the end of this project, you will be able to support cost-effective product development by conducting a value chain analysis.
-
Course by
-
Self Paced
-
3 hours
-
English
AutoML tools for data science
By the end of this project, you will learn how to perform analysis on data using different python libraries and export reports and visualization without much hassle all this with minimal coding.
-
Course by
-
Self Paced
-
3 hours
-
English

Python for Everybody
This Specialization builds on the success of the Python for Everybody course and will introduce fundamental programming concepts including data structures, networked application program interfaces, and databases, using the Python programming language. In the Capstone Project, you’ll use the technologies learned throughout the Specialization to design and create your own applications for data retrieval, processing, and visualization.
-
Course by
-
Self Paced
-
English