


Generative AI for Business Leaders
Advertising with Meta
How Google does Machine Learning


Our Courses

Create a Project Tracker with Airtable
Airtable is a cloud collaboration service that combines the features of databases and spreadsheets. In this 1.5 hour guided project, you will learn the basics of relational database and get up to speed with Airtable and create a project tracker. No prior experience is required. Although experience with spreadsheets is helpful. A free account with Airtable is required. Signing up before starting the class is recommended.
-
Course by

-
 Self Paced
-
 2 hours
-
 English

Foundations of Career Navigating and Coaching
This course is for those who are passionate about helping people find jobs aligned with their skills and interests so they can earn a living through fulfilling work. This first course in the Career Coach and Navigator Professional Certificate will provide foundational knowledge of the Career Navigator and Coach roles, and introduce relationship management and human-centered coaching and navigating. By the end of the course, you will be able to: 1. Explain the foundational concepts of Career Coaching and Navigating. 2.
-
Course by
-
Self Paced
-
16 hours
-
English

Creating a Budget with Microsoft Excel
By the end of this project, you will learn how to create a budget template in an Excel Spreadsheet by using a free version of Microsoft Office Excel. Excel is a spreadsheet that is similar in layout as accounting spreadsheets. It consists of individual cells that can be used to build functions, formulas, tables, and graphs that easily organize and analyze large amounts of information and data. While a budget helps you stay within estimated costs and expenses for either a business or a family. We will learn to create a budget both automatically and manually, step by step.
-
Course by
-
Self Paced
-
3 hours
-
English

Excel for Beginners: Introduction to Spreadsheets
This 1-hour, project-based course is an introduction to spreadsheets. We’ll be using Excel on the Web in this project, which is the free spreadsheet program offered by Microsoft.
-
Course by
-
Self Paced
-
3 hours
-
English
Meta Marketing Analytics
This eight-course program is designed for anyone looking to gain in-demand technical skills to kickstart a career as a marketing analyst or better analyze their business. No experience necessary. Developed by marketing analytics experts at Aptly and Meta, and designed to prepare you for jobs that include Marketing Analyst, Marketing Researcher, and more. You’ll learn basic marketing principles, how data informs marketing decisions, and how you can apply the OSEMN data analysis framework to approach common analytics questions.
-
Course by
-
Self Paced
-
English

Data Analysis and Visualization Foundations
Deriving insights from data and communicating findings has become an increasingly important part of virtually every profession. This Specialization prepares you for this data-driven transformation by teaching you the core principles of data analysis and visualization and by giving you the tools and hands-on practice to communicate the results of your data discoveries effectively. You will be introduced to the modern data ecosystem. You will learn the skills required to successfully start data analysis tasks by becoming familiar with spreadsheets like Excel.
-
Course by
-
Self Paced
-
English
Finding Data in Google Sheets
This is a self-paced lab that takes place in the Google Cloud console. Finding specific content in large spreadsheets can be tricky. Learn to manipulate, search and substitute values in Google Sheets using features and functions like VLOOKUP, SUBSTITUTE and QUERY.
-
Course by
-
Self Paced
-
1 hour
-
English

Excel Skills for Business
This specialization is intended for anyone who seeks to develop one of the most critical and fundamental digital skills today. Spreadsheet software remains one of the most ubiquitous pieces of software used in workplaces across the world. Learning to confidently operate this software means adding a highly valuable asset to your employability portfolio. In the United States alone, millions of job advertisements requiring Excel skills are posted every day. Research by Burning Glass Technologies and Capital One shows that digital skills lead to higher income and better employment opportunities.
-
Course by
-
Self Paced
-
English

IBM Data Analytics with Excel and R
Prepare for the in-demand field of data analytics. In this program, you’ll learn high valued skills like Excel, Cognos Analytics, and R programming language to get job-ready in less than 3 months. Data analytics is a strategy-based science where data is analyzed to find trends, answer questions, shape business processes, and aid decision-making. This Professional Certificate focuses on data analysis using Microsoft Excel and R programming language.
-
Course by
-
Self Paced
-
English

Excel/VBA for Creative Problem Solving
This Specialization is for learners wishing to dramatically change the way that they use Excel spreadsheets by unleashing the power to automate and optimize spreadsheets using Visual Basic for Applications (VBA). The first two courses will teach learners the basics of VBA through the use of dozens of educational screencasts and a series of quizzes and in-application programming assignments. Finally, in Part 3 of the course, learners will complete 3 "real world" and somewhat open ended projects, which are graded through peer review.
-
Course by
-
Self Paced
-
English

Practical Data Science with MATLAB
Do you find yourself in an industry or field that increasingly uses data to answer questions? Are you working with an overwhelming amount of data and need to make sense of it? Do you want to avoid becoming a full-time software developer or statistician to do meaningful tasks with your data? Completing this specialization will give you the skills and confidence you need to achieve practical results in Data Science quickly.
-
Course by
-
Self Paced
-
English

Google Drive: Getting Started
This is a Google Cloud Self-Paced Lab. Use Google Drive to store all your files in the cloud, including photos, Microsoft® Word® documents, Excel® spreadsheets, and more. You can also make changes to a Word file using Google Docs, or convert your Word files to Google Docs, Sheets, or Slides. You can complete this lab in 10-15 minutes or use the extra time to explore Google Drive features.
-
Course by
-
Self Paced
-
1 hour
-
English

Spreadsheets for Beginners using Google Sheets
This 2-hour long project-based course is an introduction to spreadsheets. We’ll be using Google Sheets in this project, which is the free spreadsheet program offered by Google. With that said, most of the concepts that you will learn in this project will be applicable to other spreadsheet programs, such as Microsoft Excel.
-
Course by
-
Self Paced
-
3 hours
-
English

Intro Course: Spreadsheets and Statistics
Bridge the gap between what you know and the skills you need to ensure your success and efficiency in an office setting. This course is ideal for learners who are just starting out in their professional careers, those looking to add some hard skills to their soft skills, or those looking to make the leap from contractor to full-time employee.
-
Course by

-
Self Paced
-
27
-
English

IBM Data Analyst
Prepare for a career in the high-growth field of data analytics. In this program, you’ll learn in-demand skills like Python, Excel, and SQL to get job-ready in as little as 4 months. Data analysis is the process of collecting, storing, modeling, and analyzing data that can inform executive decision-making, and the demand for skilled data analysts has never been greater. This program will teach you the foundational data skills employers are seeking for entry-level data analytics roles.
-
Course by
-
Self Paced
-
English

Introduction to Business Analysis Using Spreadsheets: Basics
In this 1-hour 30-mins long project-based course, you will learn the responsibilities of a Business Analyst such as Learn the basic concepts of data analysis and descriptive statistics. Learn how to manipulate, analyze, and visualize data in Google Sheets using functions, aggregation functions, and logical aggregation functions.
-
Course by
-
Self Paced
-
3 hours
-
English
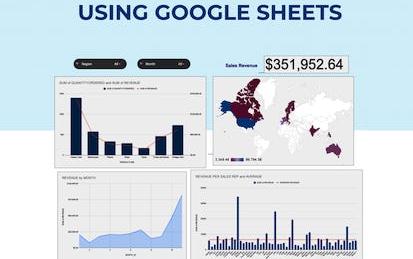
Create Charts and Dashboard using Google Sheets
In this 2-hour long project-based course, you will learn how to create effective charts and a dynamic dashboard to visualize data sets.
-
Course by
-
Self Paced
-
3 hours
-
English

Google Sheets
In this course we will introduce you to Google Sheets, Google’s cloud-based spreadsheet software, included with Google Workspace. With Google Sheets, you can create and edit spreadsheets directly in your web browser—no special software is required. Multiple people can work simultaneously, you can see people’s changes as they make them, and every change is saved automatically. You will learn how to open Google Sheets, create a blank spreadsheet, and create a spreadsheet from a template.
-
Course by
-
Self Paced
-
3 hours
-
English

Project Lifecycle, Information Sharing, and Risk Management
Every project comes with risk. If risk occurs the project team operates in a reactive mode potentially moving towards project failure. As a project manager, you will need to be vigilant and constantly evaluate and mitigate potential risks. In this course, you will learn the compelling art of risk management throughout the project lifecycle while using information sharing techniques to keep all stakeholders informed and aligned. This course introduces you to different phases in the project lifecycle, and explains the difference in the phases based on the selected project methodology.
-
Course by
-
Self Paced
-
16 hours
-
English

Data Visualization with Python
In today's data-driven world, the ability to create compelling visualizations and tell impactful stories with data is a crucial skill. This comprehensive course will guide you through the process of visualization using coding tools with Python, spreadsheets, and BI (Business Intelligence) tooling.
-
Course by
-
Self Paced
-
3 hours
-
English

Using Basic Formulas and Functions in Microsoft Excel
Have you started using spreadsheets like Excel and want to learn how to write formulas and functions to perform simple data analysis? In this project, you will learn about the general format for writing formulas and functions in Excel to perform analysis on the sales data from a sample company. In this analysis, you will calculate total sums of profits, you will learn how to use functions to analyze the popularity of the items sold and you will also learn how to calculate averages and percentages of monthly profits.
-
Course by
-
Self Paced
-
3 hours
-
English

How to use Custom and Conditional Formatting in Excel
By the end of this project, you will learn how to use conditional and custom formatting in an Excel Spreadsheet by using a free version of Microsoft Office Excel. Excel is a spreadsheet that is similar in layout as accounting spreadsheets. It consists of individual cells that can be used to build functions, formulas, tables, and graphs that easily organize and analyze large amounts of information and data. Conditional formatting is a convenient tool for data analysis and visual representation of results. Knowing how to use this tool will save you a lot of time and effort.
-
Course by
-
Self Paced
-
3 hours
-
English

Meta Marketing Science Certification Exam
This course helps you prepare for the Meta Marketing Science Certification exam. You’ll be guided through scheduling and taking the exam through Meta Blueprint. You’ll get access to the study guide and other resources to help you prepare for the exam.
-
Course by
-
Self Paced
-
1 hour
-
English
Project Management Foundations, Initiation, and Planning
To navigate today’s complex and rapidly changing work environments, many organizations divide work into projects. Project management provides a structured approach to plan and manage projects in order to achieve on-time, within-budget, and scope as planned delivery. Compare and contrast predictive and adaptive project management models. Learn to avoid common causes of project failure. Investigate how to lead effective meetings and how motivating your team can lead to project success.
-
Course by
-
Self Paced
-
20 hours
-
English

Try It: Intro to Spreadsheets
Excel skills are marketable in almost every industry. Whether you work in IT, healthcare, finance, or computer science, knowing how to operate spreadsheets can help you to organize data and gain valuable insights. This free, no-risk introductory course to spreadsheets aims to equip you with the beginner’s knowledge to navigate both Excel and Google Spreadsheets so you can bring greater solutions and organization to any project.
-
Course by
-
Self Paced
-
1
-
English