


Generative AI for Business Leaders
Advertising with Meta
How Google does Machine Learning


Our Courses

Human-Centered Design for Inclusive Innovation
This course introduces the principles and practices of human-centered design (also sometimes called “design thinking”) which are essential for developing innovative and inclusive products, services, processes and policies. You will learn by doing, experiencing the design process through exercises and a mini-bootcamp. In this course, you will learn about and experience key human-centered design practices: empathize, reframe, ideate, prototype and test. You will learn why human-centered design is a central component of Gender Analytics.
-
Course by

-
 Self Paced
-
 13 hours
-
 English

Advanced MySQL Topics
In this course, you'll begin to push beyond simple SQL statements in MySQL to an advanced level in database engineering. By the end of this course, you'll be able to: - Use control statements and variables in different contexts in MySQL - Develop user defined functions and procedures - Optimize MySQL database queries - Demonstrate a working knowledge of common table expressions and the JSON data type - Understand how and when to use triggers and events - Utilize subqueries, JOINS, views and transactions to perform data analysis - and use database optimization techniques such as MySQL transac
-
Course by
-
Self Paced
-
19 hours
-
English
The Fundamentals of Revenue Management: The Cornerstone of Revenue Strategy
With a fixed capacity, a highly disposable product and high fixed costs, hotels are a natural candidate for the application of revenue management. Originally developed by the airlines in the 1970s, these analytics-based techniques help predict consumer behavior at the hotel’s market level so that the hotel can sell each room each night at the optimum price.
-
Course by
-
Self Paced
-
11 hours
-
English
Inventory Analytics
Inventory analytics is the corner stone of supply chain analytics. A company in trade industries may have 30-50% of their assets tied up in inventory. An effective inventory management can improve revenue by increasing product variety and availability, and reduce cost and speed up cash cycle by reducing excessive inventory and waste. Through real-life examples (e.g., Amazon vs. Macy’s), you will learn hands-on tools and skills to discover and solve inventory problems by data analytics. Upon completion, you can answer the following questions: 1.
-
Course by
-
Self Paced
-
10 hours
-
English

AWS: Data Analysis and Visualization
AWS: Data Analysis and Visualization Course is the fourth course of AWS Certified Data Analytics Speciality Specialization. This course teaches Data Analysis and Visualization by exploring AWS Services such as Athena, Kinesis, QuickSight, Redshift and Kibana. The course is divided into three modules and each module is further segmented by Lessons and Video Lectures. This course facilitates learners with approximately 4:00 Hours Video lectures that provide both Theory and Hands -On knowledge.
-
Course by
-
Self Paced
-
8 hours
-
English

Azure Synapse SQL Pool - Implement Polybase
In this 1-hour long project-based course, you will learn how to implement Polybase in Azure Synapse SQL Pool. In this project, we are going to see how to implement Polybase in Azure Synapse SQL Pool. Polybase in simple words is, a feature provided by Azure SQL Pool through which you can access the data stored in Azure Data Lake Storage/Blob/HDFS using a SQL interface to access the files stored in above mentioned storage systems.
-
Course by
-
Self Paced
-
3 hours
-
English

Explore Core Data Concepts in Microsoft Azure
In this course, you will learn the fundamentals of database concepts in a cloud environment, get basic skilling in cloud data services, and build your foundational knowledge of cloud data services within Microsoft Azure. You will identify and describe core data concepts such as relational, non-relational, big data, and analytics, and explore how this technology is implemented with Microsoft Azure.
-
Course by
-
Self Paced
-
9 hours
-
English
Threat Investigation
If you are an associate-level cybersecurity analyst who is working in security operation centers, this course will help you understand how threat-centric SOC must prepare for analyzing new and emerging threats by implementing robust security investigation procedures • By the end of the course, you will be able to: • Understand cyber-threat hunting concepts • Describe the five hunting maturity levels (HM0–HM4) • Describe the hunting cycle four-stage loop• Describe the use of the Common Vulnerability Scoring System (CVSS) and list the CVSS v3.0 base metrics• Describe the CVSS v3.0 scoring compon
-
Course by
-
Self Paced
-
9 hours
-
English

Processing IoT Hub data streams with Azure Stream Analytics
In this 1-hour long project-based course, we will learn to create an IoT hub in the Azure cloud, register an IoT device within that IoT hub, send telemetry data from a raspberry pi web simulator to the IoT hub, create an Azure storage account and create stream analytics job with IoT hub as input and storage account as output so that we can store the sensor data on the Azure storage. Not only this, we will also see how we can perform queries and store specific telemetry data on the Azure storage. You must have some basic knowledge on working with Azure.
-
Course by
-
Self Paced
-
2 hours
-
English
Decisions, Decisions: Dashboards and Reports
You’re almost there! This is the third and final course in the Google Business Intelligence Certificate. In this course, you’ll apply your understanding of stakeholder needs, plan and create BI visuals, and design reporting tools, including dashboards.
-
Course by
-
Self Paced
-
27 hours
-
English

Custom Reports in Google Analytics
In this project, you will create three custom reports in Google Analytics, using three different methods. You will understand the building blocks of a custom report. You will determine what data is needed for a custom report. And, you will create the custom report to best meet your analysis and monitoring needs. You will also discover the Google Gallery where you can find various types of custom reports, and import the ones that best meet your needs. Note: This course works best for learners who are based in the North America region.
-
Course by
-
Self Paced
-
3 hours
-
English

Building a Hiring Plan by Analyzing Past Data in Sheets
By the end of this project, you will understand how HR analytics are used to perform several analyses such as analyze total headcount to be hired, consolidate the position details, provide insights that would help the Talent Acquisition Manager to arrive at the sourcing strategy, set the selection process and the assessment guidelines. All these analyses will help create an annual hiring plan for an organization. All these steps in the project are performed by individuals of the Human Resources team.
-
Course by
-
Self Paced
-
3 hours
-
English

The Nature of Data and Relational Database Design
This course provides a comprehensive overview of data, various data types, design of databases for storage of data, and creation and manipulation of data in databases using SQL. By the end of this course, students will be able to describe what business intelligence is and how it’s different from business analytics and data science, conduct a basic descriptive statistical analysis and articulate the findings, and differentiate between types of statistics.
-
Course by
-
Self Paced
-
7 hours
-
English

Assessment for Data Analysis and Visualization Foundations
This course is the final step in the Data Analysis and Visualization Foundations Specialization. It contains a graded final examination that covers content from three courses: Introduction to Data Analytics, Excel Basics for Data Analysis, and Data Visualization and Dashboards with Excel and Cognos. From the Introduction to Data Analytics course, your understanding will be assessed on topics like the data ecosystem and the fundamentals of data analysis, covering tools for data gathering and data mining.
-
Course by
-
Self Paced
-
1 hour
-
English
Foundations of Sports Analytics: Data, Representation, and Models in Sports
This course provides an introduction to using Python to analyze team performance in sports. Learners will discover a variety of techniques that can be used to represent sports data and how to extract narratives based on these analytical techniques. The main focus of the introduction will be on the use of regression analysis to analyze team and player performance data, using examples drawn from the National Football League (NFL), the National Basketball Association (NBA), the National Hockey League (NHL), the English Premier LEague (EPL, soccer) and the Indian Premier League (IPL, cricket).
-
Course by
-
Self Paced
-
49 hours
-
English
Moneyball and Beyond
The book Moneyball triggered a revolution in the analysis of performance statistics in professional sports, by showing that data analytics could be used to increase team winning percentage. This course shows how to program data using Python to test the claims that lie behind the Moneyball story, and to examine the evolution of Moneyball statistics since the book was published. The learner is led through the process of calculating baseball performance statistics from publicly available datasets.
-
Course by
-
Self Paced
-
29 hours
-
English
Text Mining for Marketing
Welcome to the Text Mining for Marketing course! This course will introduce you to the principles and methods of text mining as they apply to the field of marketing. You will learn how and why to use text mining to inform marketing decisions and strategies. This course is for everyone interested in practical applications of text mining in the marketing discipline and who wants to understand it and apply it. This course is not for those who are looking for programming instructions and mathematical routines.
-
Course by
-
Self Paced
-
21 hours
-
English
Assisting Public Sector Decision Makers With Policy Analysis
Develop data analysis skills that support public sector decision-makers by performing policy analysis through all phases of the policymaking process. You will learn how to apply data analysis techniques to the core public sector principles of efficiency, effectiveness, and equity. Through authentic case studies and data sets, you will develop analytical skills commonly used to analyze and assess policies and programs, including policy options analysis, microsimulation modeling, and research designs for program and policy evaluation.
-
Course by
-
Self Paced
-
16 hours
-
English
Intro to Improving the Patient Experience Through Analytics
This course is best suited for individuals currently in the healthcare sector, as a provider, payer, or administrator. Individuals pursuing a career change to the healthcare sector may also be interested in this course. In this course, you will have an opportunity to explore concepts and topics related to improving the patient experience and reducing pain points in healthcare processes through analytic and decision support frameworks.
-
Course by
-
Self Paced
-
20 hours
-
English

Using clinical health data for better healthcare
Digital health is rapidly being realised as the future of healthcare.
-
Course by
-
Self Paced
-
16 hours
-
English
Designing Engaging Dashboards for Healthcare Analytics
Introduces processes and design principles for creating meaningful displays of information that support effective business decision-making. Studies how to collect and process data; create visualizations (both static and interactive); and use them to provide insight into a problem, situation, or opportunity. Introduces methods to critique visualizations along with ways to answer the elusive question: “What makes a visualization effective?” Discusses the challenges of making data understandable across a wide range of audiences.
-
Course by
-
Self Paced
-
16 hours
-
English
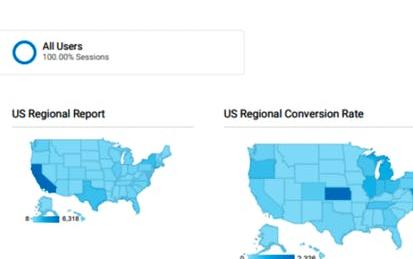
Building Custom Regional Reports with Google Analytics
In this 2 hours project you will learn how to build custom regional reports with Google Analytics. You will familiarize with Google Analytics and its usage, create a marketing custom regional dashboard with table and graph widgets, customize a standard geo report and scheduled the report you have designed to be sent monthly via email to a distributed regional marketing team.
-
Course by
-
Self Paced
-
3 hours
-
English

Database Engineer Capstone
In this course you’ll complete a capstone project in which you’ll create a database and client for Little Lemon restaurant. To complete this course, you will need database engineering experience. The Capstone project enables you to demonstrate multiple skills from the Certificate by solving an authentic real-world problem. Each module includes a brief recap of, and links to, content that you have covered in previous courses in this program.
-
Course by
-
Self Paced
-
18 hours
-
English
AWS: Security in Data Analytics
AWS: Security in Data Analytics Course is the fourth course of AWS Certified Data Analytics Speciality Specialization. This course teaches learners the concepts of Security in Data Analytics with reference to AWS. Learners will be able to analyze appropriate authentication and authorization mechanisms, apply data protection and encryption techniques and data governance and compliance controls in this course. The course is divided into three modules and each module is further segmented by Lessons and Video Lectures.
-
Course by
-
Self Paced
-
6 hours
-
English
Tools for Exploratory Data Analysis in Business
This course introduces several tools for processing business data to obtain actionable insight. The most important tool is the mind of the data analyst. Accordingly, in this course, you will explore what it means to have an analytic mindset. You will also practice identifying business problems that can be answered using data analytics. You will then be introduced to various software platforms to extract, transform, and load (ETL) data into tools for conducting exploratory data analytics (EDA).
-
Course by
-
Self Paced
-
19 hours
-
English